Hybrid Sidelobe Recognition Method Using Boresight Error and Quadrant Signal Difference for Monopulse Array
Article information
Abstract
In this paper, a sidelobe recognition method using boresight error and quadrant signal difference for a monopulse array is proposed. A conventional sidelobe recognition method compares the difference between the sum and delta channels. This method works well for the azimuth and elevation planes. However, the method is prone to many errors in the diagonal region of the two-dimensional plane. To overcome this problem, a method to calculate the deviation of the boresight error difference with different frequency combinations and a threshold to identify the sidelobe is proposed, and the method is validated to significantly reduce the error region. If a four-quadrant signal can be extracted separately, the signal deviation can be calculated and compared with the threshold, and the error region can be further reduced. The effects of each margin and bandwidth on the recognition performance are analyzed, and a slot array antenna is simulated to assess the method’s effectiveness.
I. Introduction
In monopulse radar systems, sidelobe recognition is a necessary function for detecting a target when a clutter or jamming signal in an electronic warfare environment is received from an angle other than the main beam of the antenna. It is common to apply an auxiliary antenna [1–9], sum/delta monopulse [10], interferometer [11], or time-modulation [12] methods for sidelobe recognition.
When an auxiliary antenna, such as a horn aperture or a microstrip patch, is used, the gain is usually designed to cover the sidelobe region of the main antenna. In this case, additional space and a receiver channel are required. When the gain of the main antenna is increased (e.g., large aperture) or the sidelobe is high (e.g., radiation characteristics at edge frequencies), it becomes difficult to create the pattern design of the auxiliary antenna because nulls can occur in the auxiliary antenna pattern if the gain is increased to a certain value (e.g., more than 13 dBi [13]). Another method is to recognize the sidelobe using only the sum (∑) and two difference (delta) channels (Δazimuth and Δelevation) without an auxiliary antenna [10]. Two delta channels can be regarded as auxiliary antennas, and the main and sidelobe regions can be identified using a simple method, as shown in Fig. 1. In this equation, T1 is a threshold magnitude in dB, and this value could be changed with the antenna characteristics, the definition of the main beam, the required detection probability, and the false-alarm rate [1].
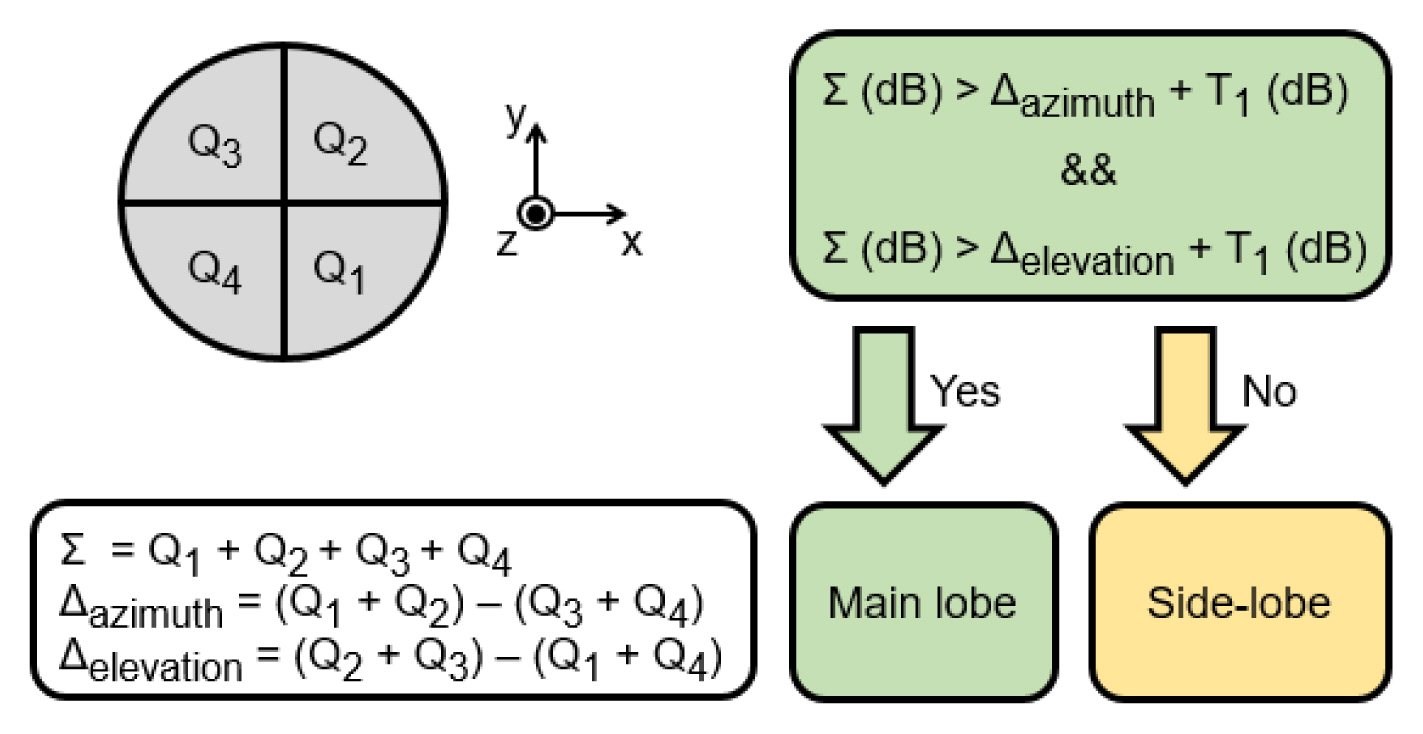
Conventional sidelobe recognition method.
In general, for a one-dimensional (1D) azimuth plane or elevation plane in a “+” axis monopulse system, the abovementioned method works well because the magnitudes of delta channels are usually greater than those of the sum channels in the sidelobe region. However, in the diagonal region of the two-dimensional (2D) plane, there are many areas where the delta channel magnitudes are low, thus reducing the accuracy of the sidelobe recognition. In this paper, a hybrid sidelobe recognition method, incorporating a conventional sum-delta magnitude comparison with boresight error (BSE) and a quadratic signal difference comparison, is proposed to overcome the aforementioned problems. It is assumed that the incoming signals do not fluctuate, and the range and Doppler gating are not considered for the sake of simplicity. The details of the proposed method and the simulated results are presented and discussed in the following sections.
II. Hybrid Sidelobe Recognition Method
Fig. 2 illustrates the proposed sidelobe recognition method employing sum-delta comparison, BSE comparison, and four-quadrant signal comparison. Here, F1 and F2 denote lower- and upper-edge frequencies, respectively. It has three recognition gates: 1, 2, and 3. If signals with two independent frequencies pass through the above three gates sequentially, the signals are regarded as the main lobe signals. Otherwise, they are considered sidelobe signals. In other words, the above three gates correspond to the main lobe conditions. The concept behind this process is that one or more of the abovementioned three conditions could be violated in the sidelobe region.
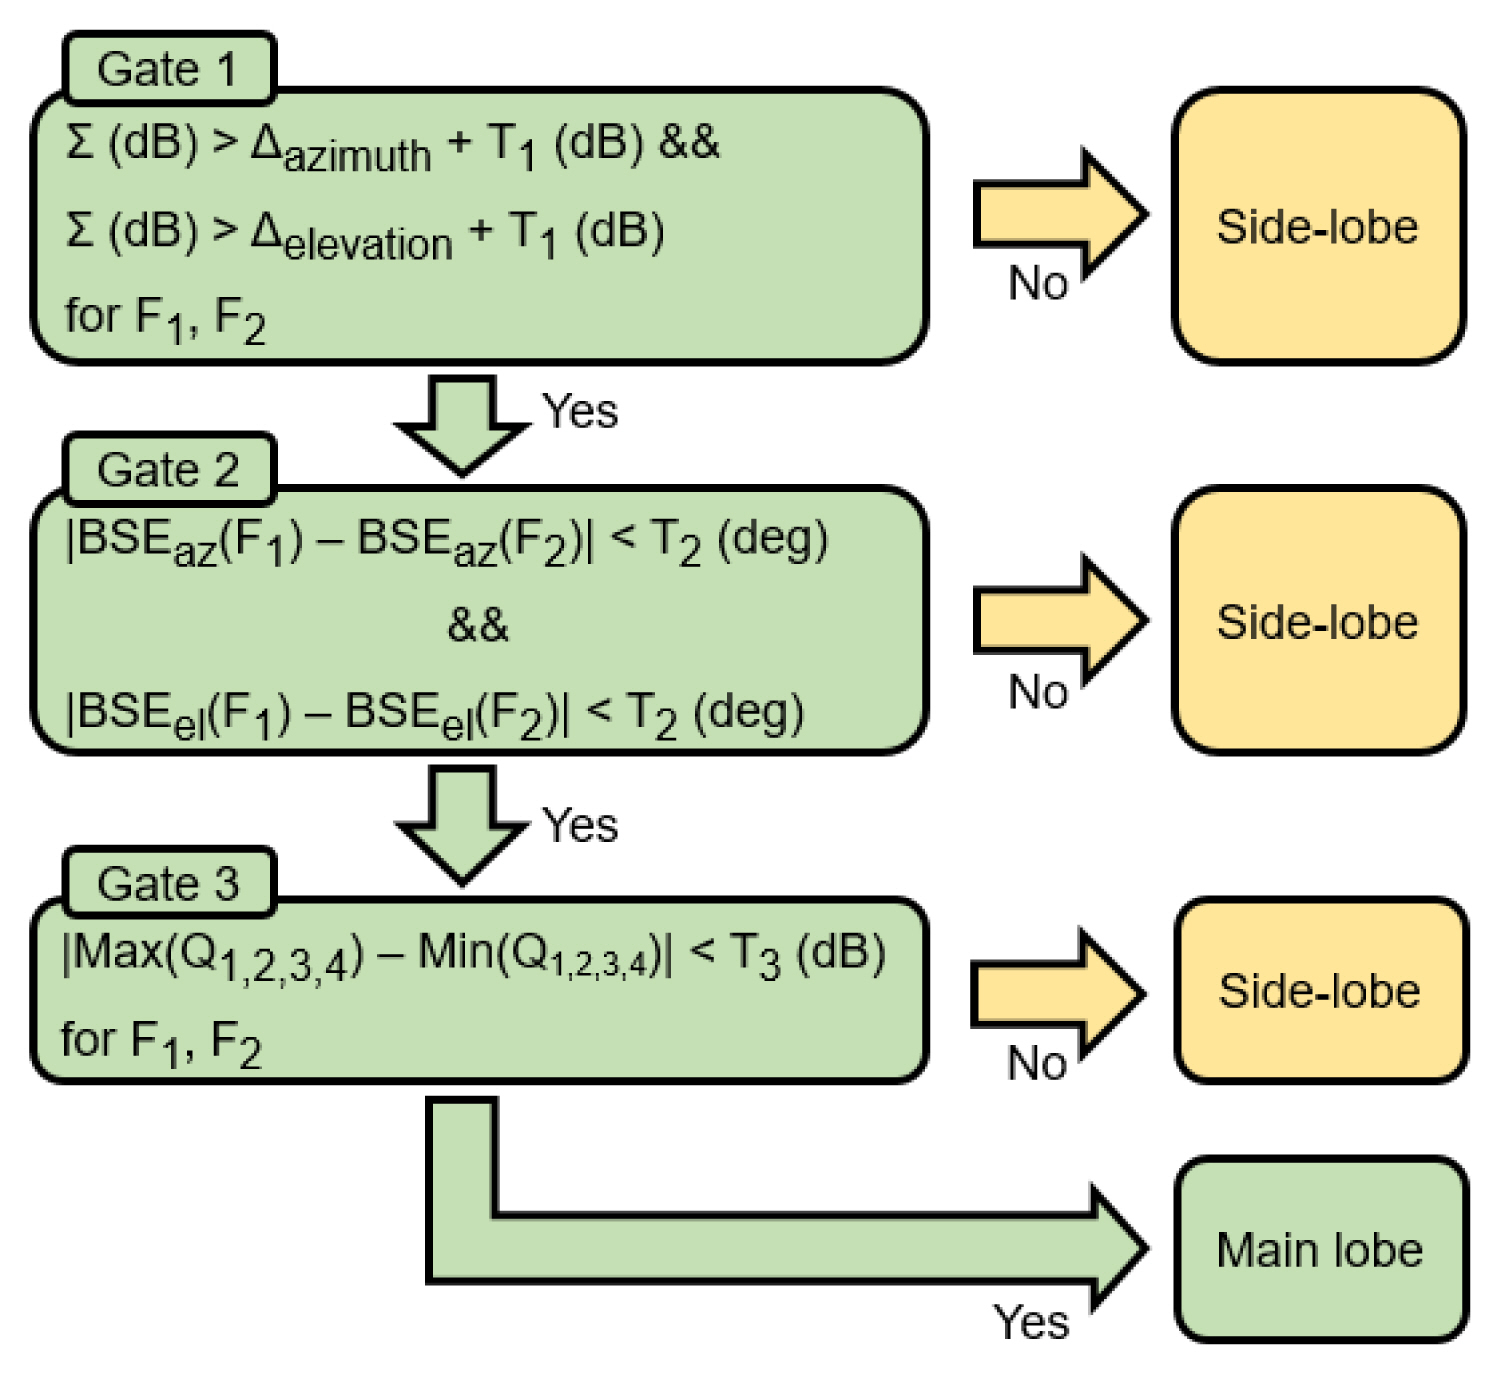
Proposed hybrid sidelobe recognition method.
Recognition Gate 1 compares the magnitudes of the sum and delta signals for each frequency. This is similar to the conventional method (Fig. 1). Threshold T1 can be adjusted with the definition of the main beam and the amplitude distribution of the aperture. A reference value of 1.0 dB was chosen.
Recognition Gate 2 compares the BSEs of the sum/delta monopulse for the two frequencies. Here, BSE can be calculated using the formula 1/K × Im(Δ/∑), where K denotes a monopulse slope for azimuth or elevation. In the main lobe region, the BSEs are expected to be nearly the same. Threshold T2 can be adjusted, considering the nonlinear property of the monopulse curve. In the sidelobe region, several nulls and peaks occur in the radiation patterns, where the angles are dependent on the antenna geometry, weighting distribution, mutual coupling, and frequency. Therefore, BSEs usually have different values in the sidelobe region. As the frequency separation (F1 – F2) or the bandwidth [BW (%)= (F1 – F2)/F0, where F0 is (F1 + F2)/2] increases, the deviation of the BSE also increases in the sidelobe region, which is preferable for sidelobe recognition. The chosen reference value was T2 = 0.3°.
Recognition Gate 3 compares the magnitudes of the four-quadrant signals (Q1, Q2, Q3, and Q4). Obviously, the difference would be very small in the main lobe region because of the symmetry of the two axes. Threshold T3 should be chosen carefully, considering the maximum difference in the main lobe. This is an optional method because some monopulse arrays have only three channels (∑, Δazimuth, and Δelevation). In this case, quadrant signals are difficult to extract. The chosen reference value was T3 = 1.0 dB.
A simple example (ideal circular array antenna, Fig. 3(a)) was selected to analyze the proposed method. For the weighting, a Taylor 25-dB (other values are also possible) distribution was used for the low sidelobe level. The simulations were performed in the developed code in MATLAB, and the element pattern was assumed to be a cosine pattern (0.8 × cos θ + 0.2). The radiation patterns of the sum, delta azimuth/elevation, and four quadratic signals are represented in Fig. 3(b)–3(h).
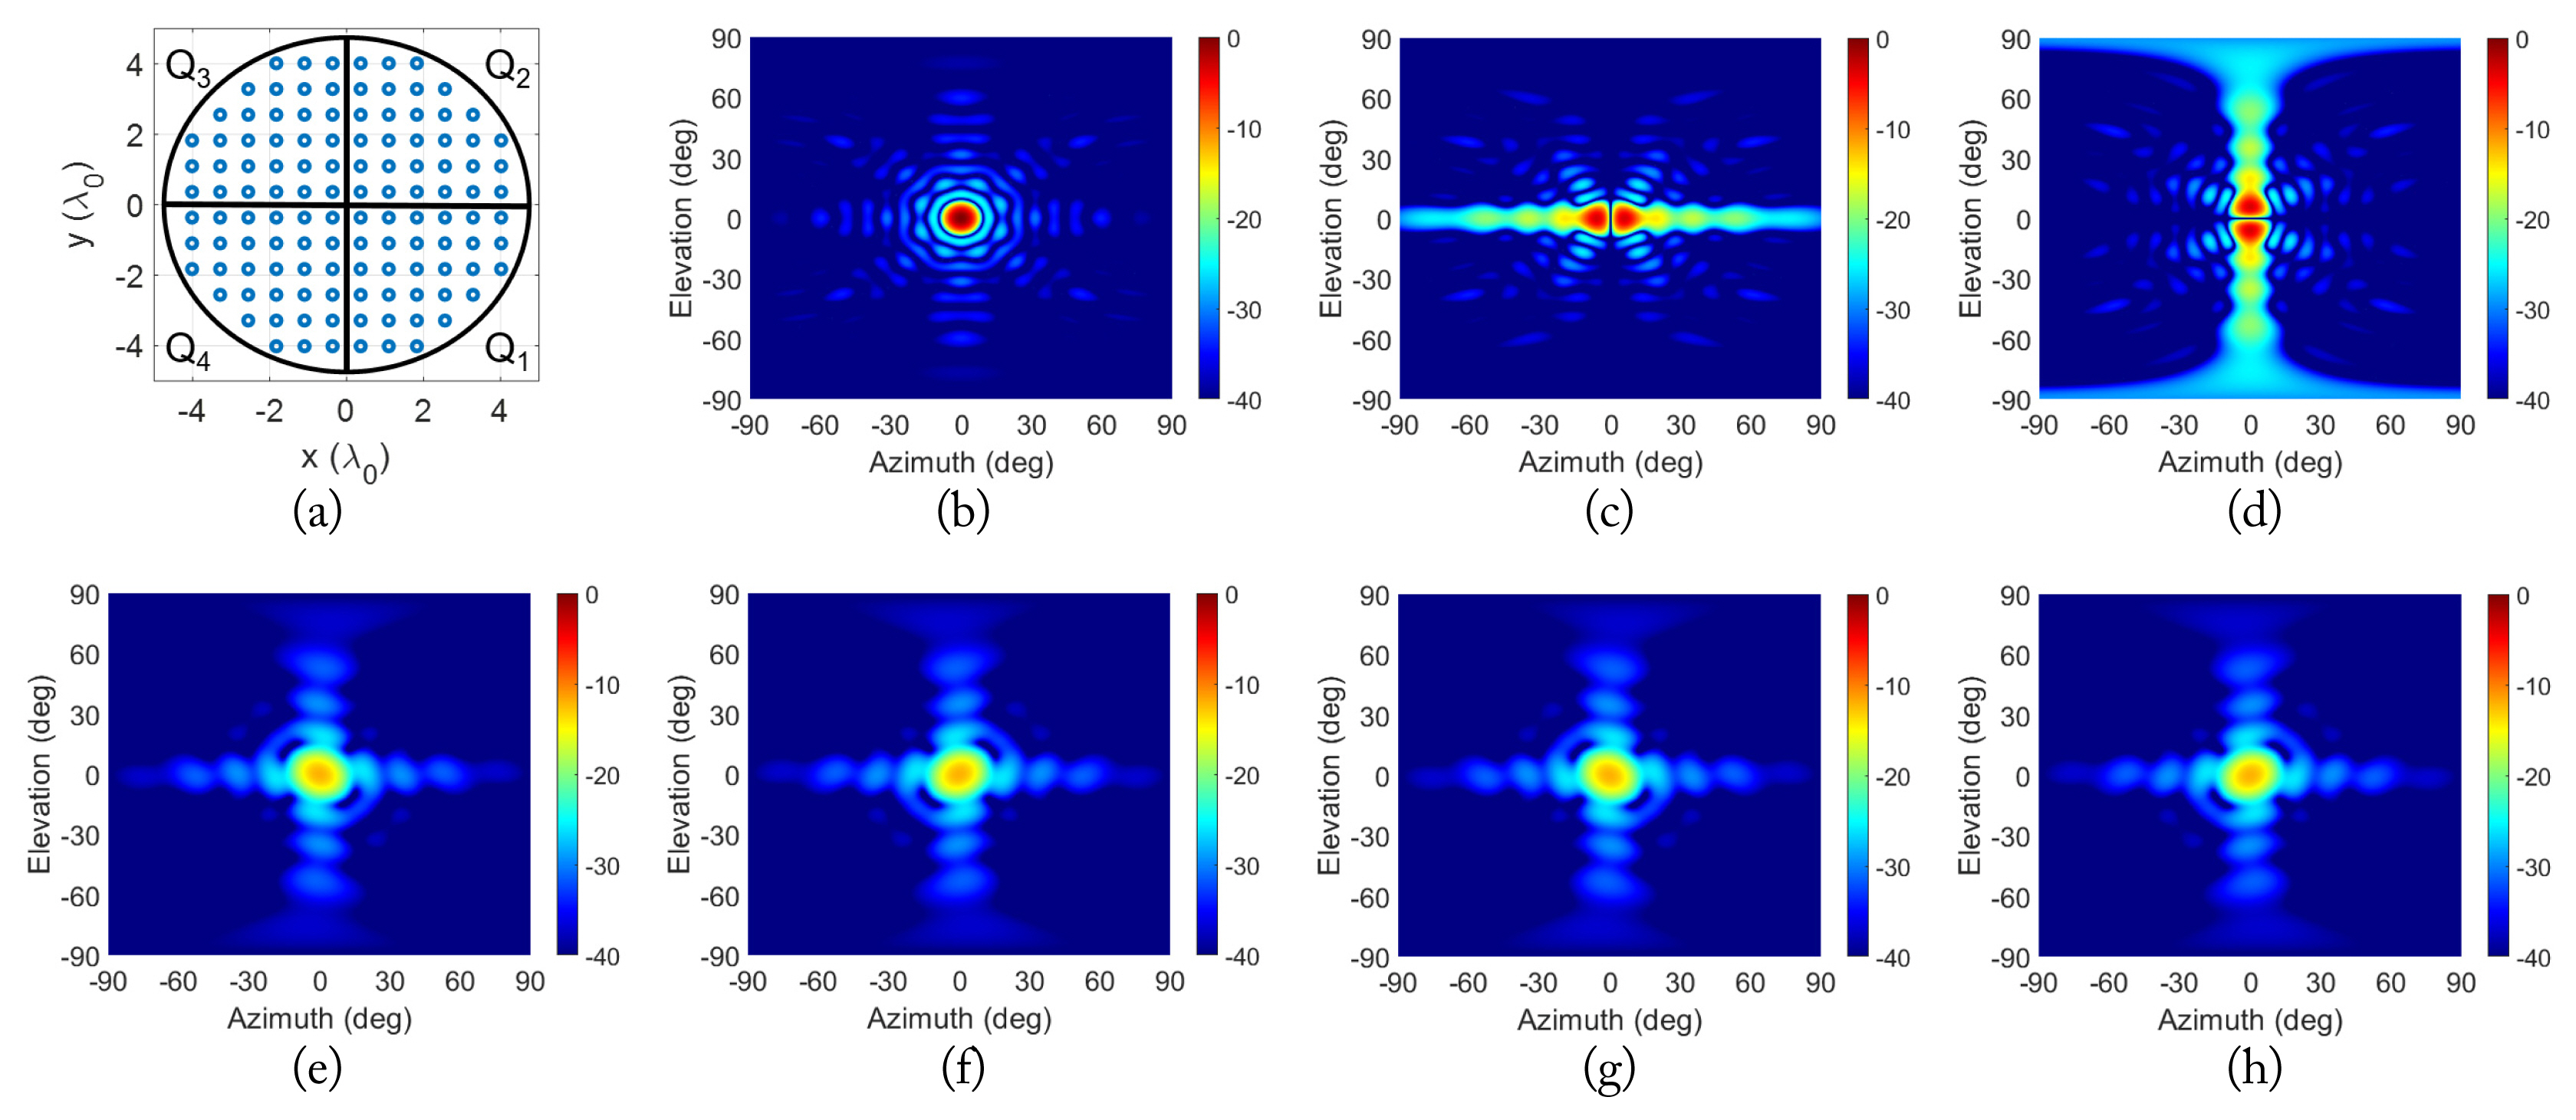
A 12 × 12 circular monopulse array: (a) geometry and various patterns for the center frequency (F0), (b) sum, (c) delta azimuth, (d) delta elevation, (e) Q1, (f) Q2, (g) Q3, and (h) Q4.
Fig. 4 shows the recognition results after Gate 1 was applied. For the center frequency F0, F1 (0.985 × F0) and F2 (1.015 × F0) denote the edge frequencies, for which the bandwidth is 3%. Red (1) and blue (0) colors indicate the recognition results of the main and the sidelobes, respectively. The angular step is 0.50°. Although the recognition works well for two principal planes (azimuth or elevation plane), there are many errors in the other regions. The error rate is defined as the number of angles in red divided by the number of angles in red or blue colors in the sidelobe region. The error rate in the sidelobe region using Gate 1 is calculated to be 10.21%. Although this error is relatively small compared to that of a single frequency (17.06% of F1 or 18.03% of F2), the error rate might be insufficient for clutter or jamming environments.
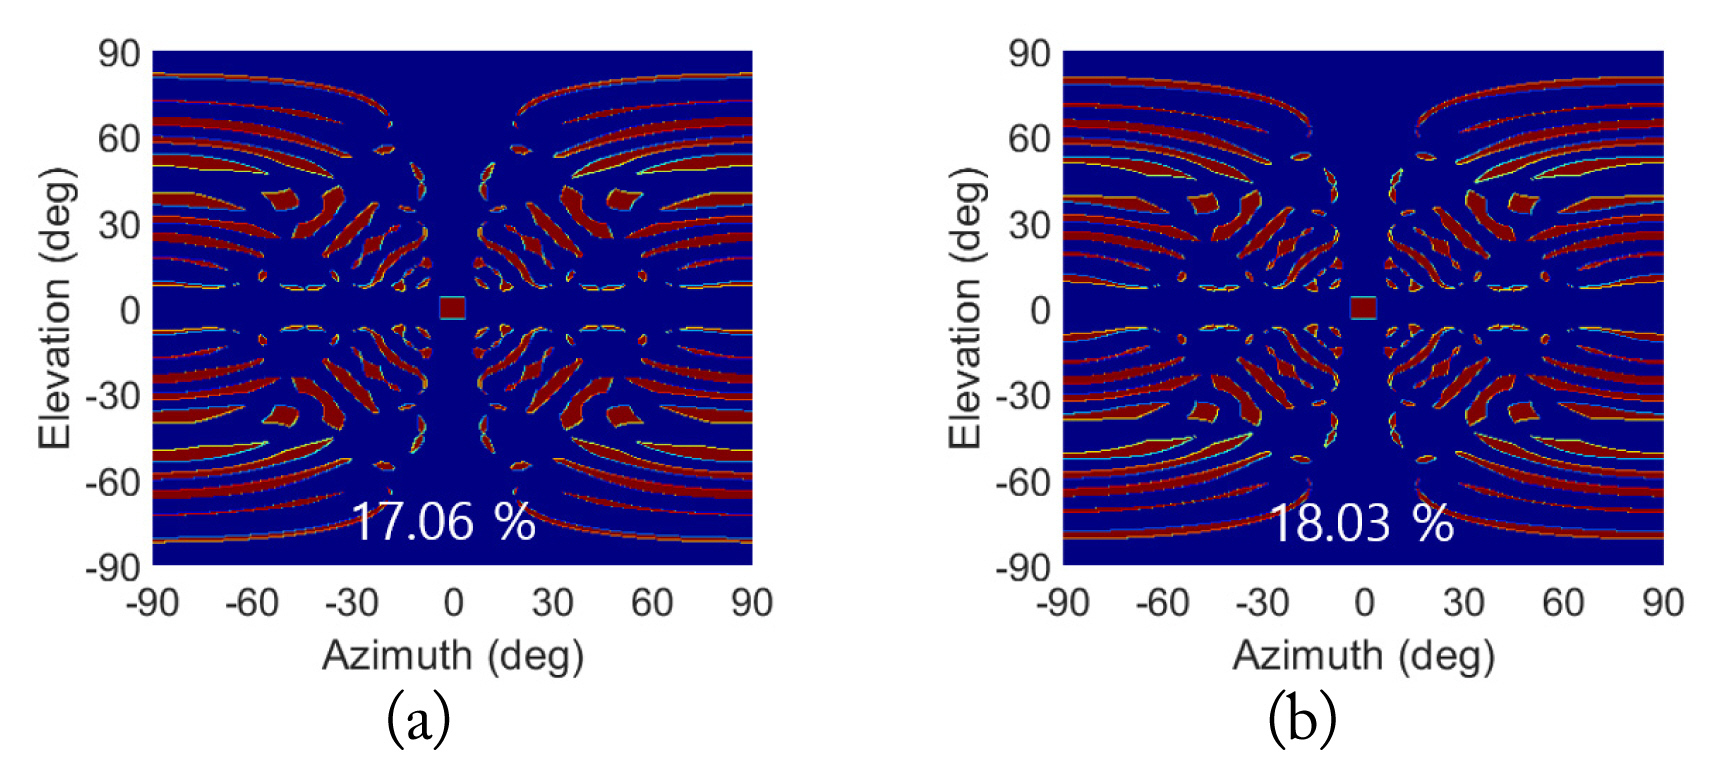
Sidelobe recognition results (red = main lobe, blue = sidelobe) after Gate 1 for two different frequencies. (a) F1 and (b) F2. T1 = 1.0 dB, T2 = 0.3 deg, T3 = 1.0 dB, and BW = 3%.
The recognition accuracy could be improved by applying Gate 2. When only Gate 2 was used (Fig. 5(a)), the sidelobe recognition error was significantly reduced (0.57%). When Gates 1 and 2 were sequentially applied, the error rate was further reduced to 0.11%. The remaining sidelobe error might be eliminated by using other frequency combinations.
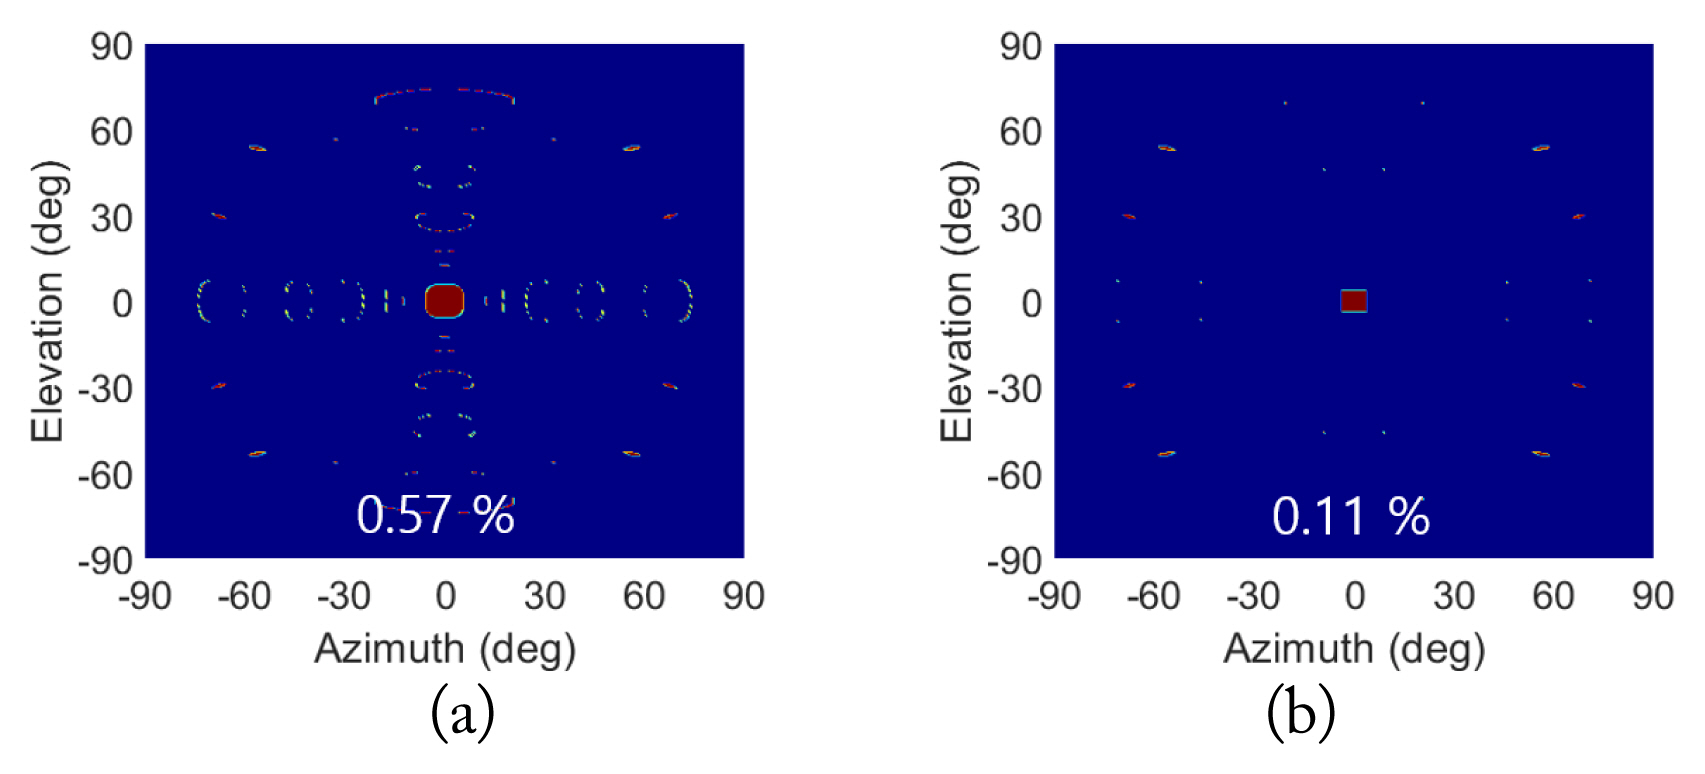
Sidelobe recognition results (red=main lobe, blue = sidelobe) after (a) only Gate 2 was applied and (b) Gates 1 and 2 were applied. T1 = 1.0 dB, T2 = 0.3°, T3 = 1.0 dB, and BW = 3%.
The recognition accuracy of Gate 3 is shown in Fig. 6. When only Gate 3 was used, the recognition error rates were 27.60% (F1 only), 29.85% (F2 only), and 19.53% (both F1 and F2). However, by combining Gate 3 with Gate 1 (Fig. 6(c)) or by combining all three gates (Fig. 6(d)), the error rates in the sidelobe region were significantly reduced to 0.06% and 0.00%, respectively. Therefore, by combining recognition criteria with suitable threshold values and the operating bandwidth, the sidelobe recognition errors could be significantly reduced.

Maximum quadratic signal difference (F1) (a) and sidelobe recognition results (red=main lobe, blue = sidelobe) after (b) only Gate 3 was applied (F1), (c) Gates 1 and 3 were applied, and (d) Gates 1, 2, and 3 were applied. T1 = 1.0 dB, T2 = 0.3°, T3 = 1.0 dB, and BW = 3%.
Furthermore, several trade-off studies were conducted, using ideal radiation patterns of the circular array antenna (Fig. 7). If the sum/delta threshold T1 increased, the sidelobe error rate of Gate 1 was reduced from 11.5% to 6.8%, whereas the effective main lobe beamwidth decreased from 7.8° to 6.4° (Fig. 7(a)). Here, the effective main lobe beamwidth is assumed to be the region satisfying Gate 1 in the main beam and is dependent on T1 because the intersection points of the ∑ and Δazimuth + T1 (or Δelevation + T1) are dependent on T1. These sidelobe error rates might be insufficient for clutter or jamming environments.
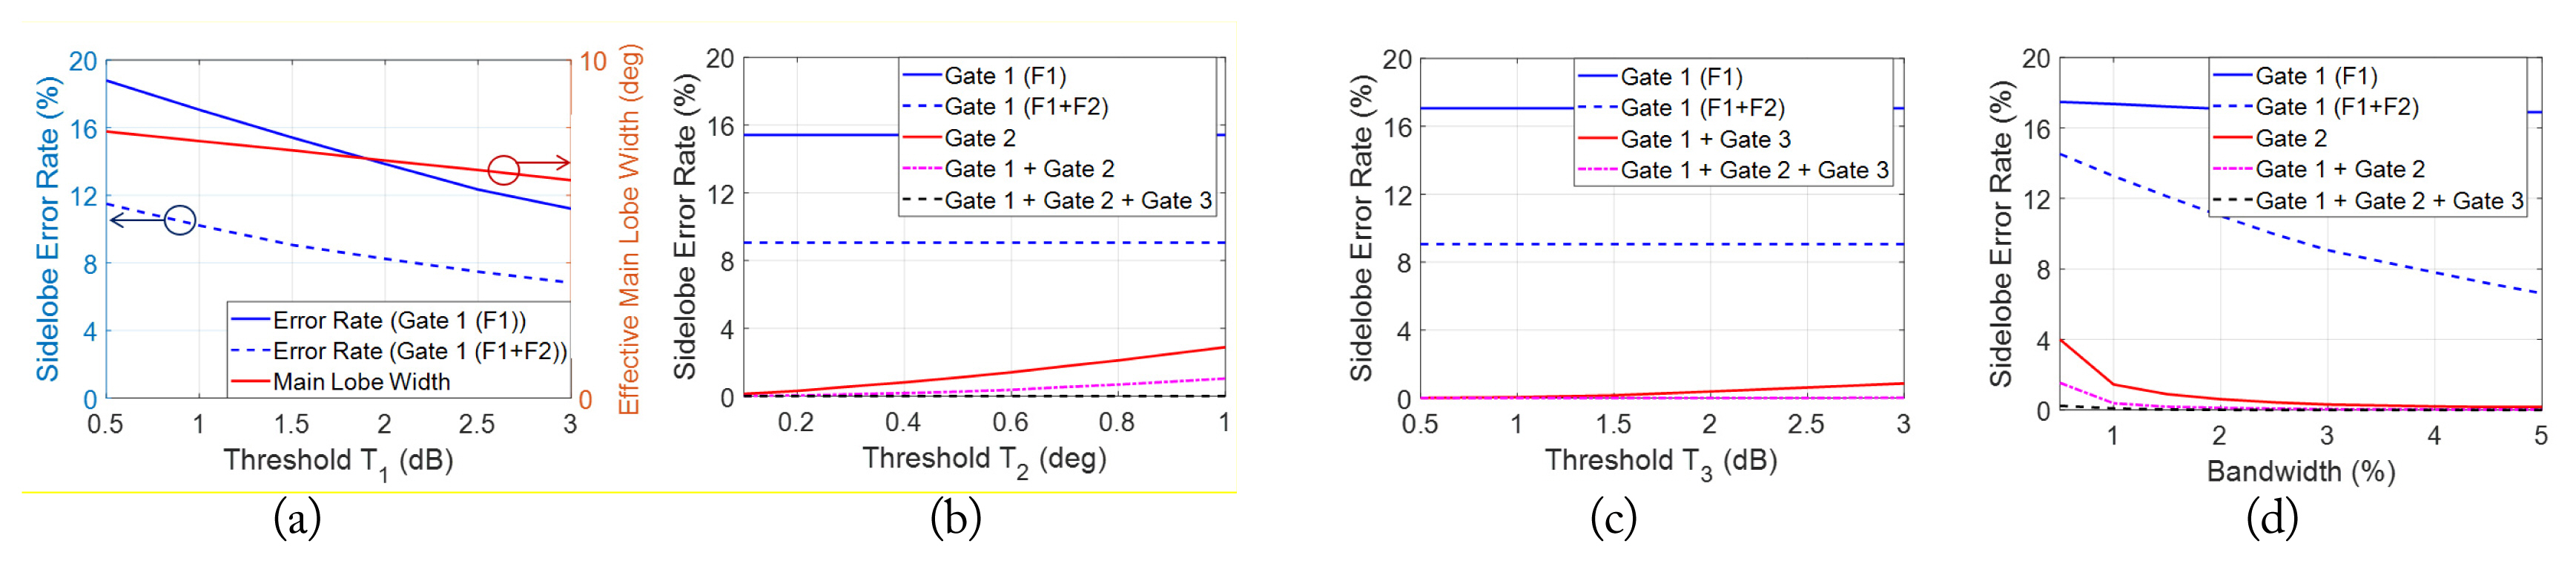
Sidelobe error rate with (a) T1, (b) T2, (c) T3, and (d) operating bandwidth for various gate combinations.
If the BSE threshold T2 increased, the sidelobe error rate also increased. As noted in a previous study [5], if the threshold was too small, there would be a recognition error in the main lobe region. T2 could also be adjusted by considering the signal-to-noise ratio and predicted geometry of the clutter or jammer.
If the quadratic signal threshold (T3) increased, the sidelobe error rate of the combination of Gates 1 and 3 also increased (Fig. 7(c)). Even if a lower T3 could be advantageous in an ideal case, some margin of error might be required because of the feed network characteristics, the quadratic pattern symmetry, and so on.
If the bandwidth increased, the sidelobe error rate decreased because more changes occurred in the sidelobe region (Fig. 7(d)). Because the bandwidth is usually limited by the antenna and receiver characteristics, using two edge frequencies to apply the recognition method is recommended.
The proposed method could be used for various ranges of design sidelobe levels. The effects of the designed sidelobe levels and the recognition error rates are listed in Table 1. The error rate of the proposed method (Gates 1 + 2 or Gates 1 + 2 + 3) was significantly reduced compared to the conventional method (Gate 1).

Sidelobe error rate (%) with various configurations of sidelobe levels T1 = 1.0 dB, T2 = 0.3°, T3 = 1.0 dB, and BW = 3%
III. Verification using Waveguide Slotted Array
To verify the proposed method, simulations were performed on a circular broad-wall slot array antenna. The antenna had a “+” monopulse axis and 30 radiating slots for each quadrant (Fig. 8(a)). The dimensions of each radiation slot (length, offset) and distribution slot (length, inclined angle) were calculated according to Elliot’s design equations [14–16]. The distance between adjacent slots is 0.73 λ0, where λ0 denotes the wavelength corresponding to the center frequency. Considering the sidelobe at the edge frequencies, a Taylor 34-dB distribution was applied for amplitude weighting.
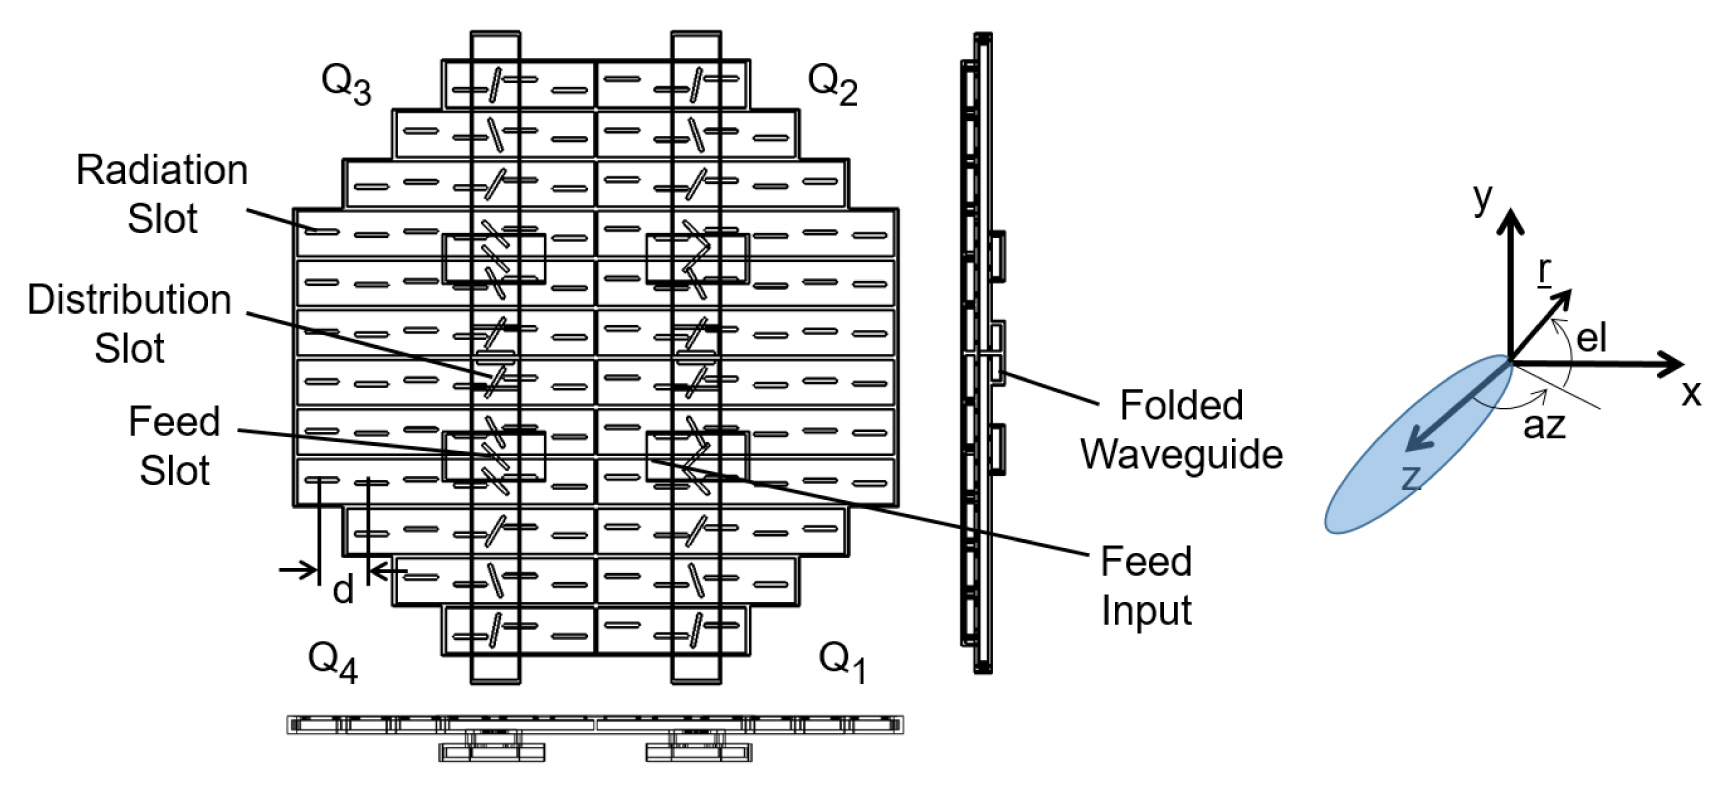
Geometry of circular 12 × 12 broad-wall slot array.
The simulated radiation patterns using CST Microwave Studio (time domain solver) are shown in Fig. 9. Owing to the resonant characteristics of the slots and waveguides, the maximum sidelobe level at the edge frequency (0.985 × F0) is −23.2 dB in the elevation plane.
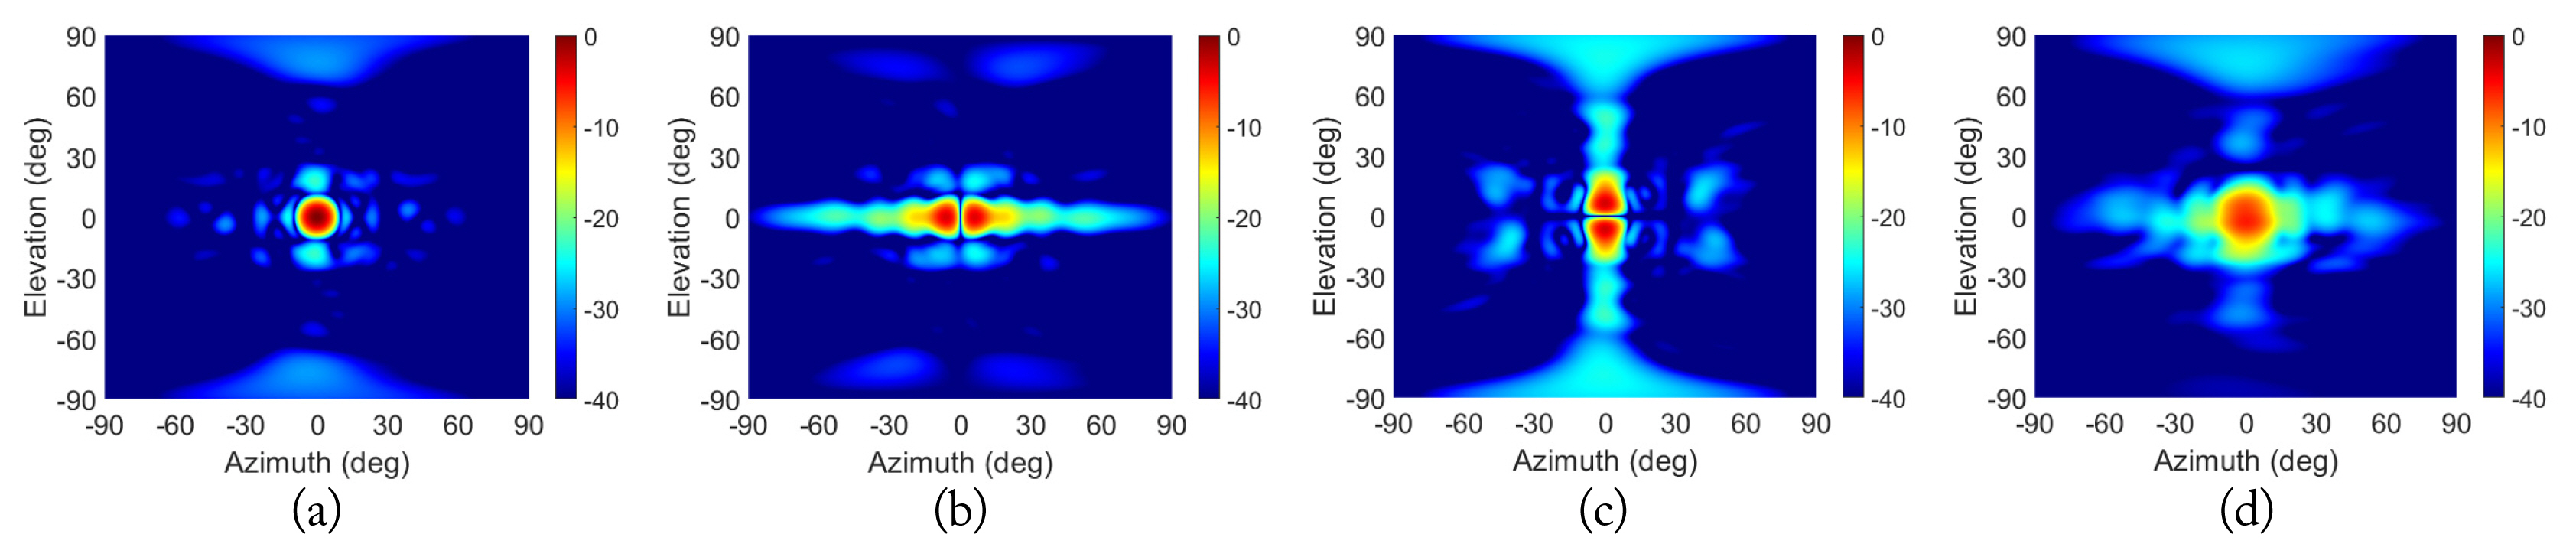
Electromagnetic simulation results of radiation pattern at f = 0.985 × F0: (a) sum, (b) delta azimuth, (c) delta elevation, and (d) Q1.
The recognition results with Gates 1, 2, and 3 are represented in Fig. 10. The chosen threshold values were T1 = 1.0 dB, T2 = 0.3°, and T3 = 2.0 dB. Owing to the resonant slot, the error rates of the sidelobe recognition with the antenna characteristics, such as mutual coupling and Gate 1, were lower than the ideal simulation result (Fig. 7), and the calculated values were 6.31% and 3.07% for BW = 1.5 % and 3.0 %, respectively. As expected, when Gate 2 was added, the error rates were significantly reduced to 0.93% and 0.54% for BW = 1.5% and 3.0%, respectively. If all three gates were applied, the error rate was reduced to less than 0.1%.

Sidelobe recognition results (red = main lobe, blue = sidelobe) using electromagnetic simulation of circular 12 × 12 slot array. Recognition after Gate 1 only: (a) BW = 1.5% and (b) BW = 3.0%. Recognition after Gates 1 and 2: (c) BW = 1.5% and (d) BW = 3.0%. Recognition after Gates 1, 2, and 3: (e) BW = 1.5% and (f) BW = 3.0%. T1 = 1.0 dB, T2 = 0.3°, and T3 = 2.0 dB.
IV. Conclusion
A hybrid sidelobe recognition method using BSE and quadrant signal difference for a monopulse array system is proposed in this study. An appropriate selection of each threshold value (T1, T2, and T3), considering the array geometry and monopulse characteristics, could significantly reduce the recognition error rate. Additionally, the operating bandwidth is an important parameter for the recognition performance. A circular broad-wall waveguide slot array antenna was simulated and analyzed to verify the proposed method. The recognition error was reduced from 3.07% (Gate 1) to 0.54% (Gates 1 and 2) or 0.01% (all three gates). In future research, signal-to-noise ratio, target and receiver characteristics, and so on, could be considered to select the threshold values. The proposed method can be utilized for simple monopulse array systems in clutter and electronic warfare environments, among others.
Acknowledgments
This work was supported by the Agency for Defense Development Grant, funded by the Korean government.
References
Biography

Daewoong Woo received a B.S. degree in electronic and electrical engineering from Kyungpook National University, Daegu, Republic of Korea in 2007 and a Ph.D. degree in electrical engineering from Pohang University of Science and Technology (POSTECH), Pohang, Korea in 2013. He joined the Agency for Defense Development, Daejeon, Korea in 2013, where he is currently a senior researcher. His current research interests include phased array antennas, slot array antennas, periodic structures, and direction-finding.

Jung-Won Lee obtained B.S., M.S., and Ph.D. degrees in electrical and electronic engineering from Yonsei University, Seoul, Republic of Korea in 2007, 2009, and 2014, respectively. He joined the Agency for Defense Development, Daejeon, Korea in 2014, where he is currently a senior researcher. His current research interests include RADAR signal processing and RADAR system design.

Kyu-Young Hwang earned B.S., M.S., and Ph.D. degrees in electrical engineering from Pohang University of Science and Technology (POSTECH), Pohang, Republic of Korea in 1999, 2001, and 2007, respectively. He joined the Agency for Defense Development, Daejeon, Korea in 2011, where he is currently a principal researcher. His current research interests include radar system design and adaptive signal processing for radar systems.

Deok Kyu Kong received B.S. and M.S. degrees in electrical engineering from Ajou University, Suwon, Republic of Korea in 1994 and 1996, respectively. He earned a Ph.D. degree in electrical and electronic engineering from Yonsei University, Seoul, Korea in 2021. He joined the Agency for Defense Development, Daejeon, Korea in 1996, where he is currently a principal researcher. His current research interests include wideband antennas and direction-finding antennas.