


I. Introduction
An electromagnetic pulse (EMP) bomb generates electromagnetic waves through a powerful explosive force that temporarily or permanently damages nearby electronic devices. These devices can incapacitate entire electronic systems, including air defense systems such as radar. Most electronic equipment parts are highly vulnerable to EMP because they have been miniaturized and integrated. In addition, social infrastructure, such as communication networks and power grids, are also highly dependent upon electronic equipment, which can cause major damage and confusion in the event of an EMP attack.
The electronic beam-steering radar offers several advantages: rapid beam scanning, easy array expansion, and quick repair and replacement in case of damage [1–5]. However, the integrated circuit (IC) in the electronic beam-steering radar may be easily damaged via EMP attacks. If the IC circuit built into the radar is damaged, the electronic beam-scanning function becomes paralyzed, and the radar capability may also be lost. In addition, since it is equipped with a high-power amplifier, it generates substantial heat when used for a long time. An air conditioning system is required to remove this heat, which increases the space and weight of the system.
On the other hand, the latest fighter-mounted radar must neutralize the enemy’s radar system or the electronic equipment of the aircraft with a high-power electromagnetic wave beam. One high-power source is required to radiate such high-power electromagnetic waves, which must be able to dispose of excess heat. To solve this problem, it is preferable to adopt a single high-power source, such as a traveling-wave tube (TWT) [6], and to distribute power to each array antenna using a waveguide structure. By replacing the electronic phase shifter of the array antenna for beam scanning with a mechanical one, the risk of damage to the high-frequency power amplifier and the phase shifter of the electronic beam-steering radar from an EMP can then be mitigated.
Therefore, this paper proposes a new sliding waveguide beam-steering array antenna that is capable of beam steering via mechanical manipulation to solve the problem of overheating in each array antenna amplifier and to address the vulnerability of aircraft-mounted electronic beam-steering radar to EMP attacks.
II. Antenna Design
1. Concept of Design
A high-frequency, high-power signal from a single source is supplied to each array antenna using the power divider of the waveguide (Fig. 1). The heat control device can be simplified by alleviating the problem of heat in each array antenna and each high-power amplifier of the existing electronic beam-steering radar by adopting a single high-power source. In addition, it is possible to prevent damage to the amplifier and the phase shifter due to EMP attacks. The waveguide divider has the advantage of transmitting a high-power, high-frequency signal while minimizing loss. In addition, the high-power, high-frequency signal supplied to each array antenna can enable beam scanning by adjusting the arrayed waveguide’s length. By driving a step motor attached to the waveguide with a control device, the length of the waveguide can be adjusted. A flexible cable is inserted between the sliding waveguide and the power divider to flexibly adjust the length of the waveguide. In this paper, the waveguide length change was performed manually, and only the radio-frequency (RF) electrical properties were presented.
2. Design of a Basic Antenna
A basic sliding waveguide antenna was designed to serve as the foundation for a mechanical beam-steering array antenna. Fig. 2(a) illustrates the basic structure of the proposed sliding waveguide antenna.
The rectangular waveguide antenna was adopted as a standard waveguide WR-90 at 9.375 GHz. The thickness of the waveguide was 1 mm, and the feeding structure was designed as an end-launch feeding method [7] in consideration of spacing and the sliding function. In addition, to adjust the phase difference of the feeding point of each antenna based on the length of the sliding waveguide, a waveguide of the same metal thickness was overlaid on the outside of the basic waveguide. The width “a” of the outer rectangular waveguide was 24.86 mm, and the height “b” was 12.16 mm. First, the diameter “d” of the feed line was adjusted to maximize the −10 dB bandwidth. It was simulated using the CST Microwave Studio 2022 version.
Fig. 2(b) illustrates the characteristics of S11 according to the change in diameter “d” of the feed line. At a center frequency of 9.375 GHz, a −10 dB bandwidth was obtained at 428 MHz (4.6%) when “d” was 2.8 mm. As the diameter “d” of the feeder increased, the −10 dB bandwidth increased. This is because the surface current path increases as the feed line becomes thicker. Accordingly, the resonance frequency decreased slightly. Fig. 2(c) indicates the S11 characteristics according to the change in the basic sliding waveguide length “L.” It was confirmed that the S11 was not constant in the 8.6–10 GHz band. This is a result of the standing wave in the waveguide due to a mismatch between the characteristic impedance of 528 Ω in the TE10 mode of the rectangular waveguide and the 377 Ω in free space [8].
Fig. 3(a) illustrates the structure of the ridge attached to the aperture of the sliding waveguide. First, S11 values for various curvatures “r” of the ridge were presented in Fig. 3(b). As the “r” value increased, the matching characteristic improved, but the limit value was set to 0.23 in consideration of the antenna array spacing. Subsequently, S11 values for various curvatures “s” of the ridge were displayed in Fig. 3(c). Similarly, as the value of “s” increased, the matching characteristics improved, but the limit value was set to 0.07. Finally, Fig. 3(d) indicates S11 based on the length of the ridge “RL.” The frequency band lowered as the ridge’s length became longer. These three parameters were adjusted appropriately and optimized.
As illustrated in Fig. 4(a), a ridge-optimized curvature was attached to the aperture of the sliding waveguide to solve the problems. When the length “L” of the ridge sliding waveguide was physically adjusted, as shown in Fig. 4(b), the −10 dB bandwidth was 1.5 GHz (16%). The ridge structure ensures proper matching between the impedance of the waveguide and of free space. Fig. 4(c) depicts the surface current of the ridge waveguide. The current flows from the inside of the waveguide to the ridge, but because the ridge is thin, the outer surface is not affected; thus, there is no problem with sliding.
3. Array Antenna for Beam Steering
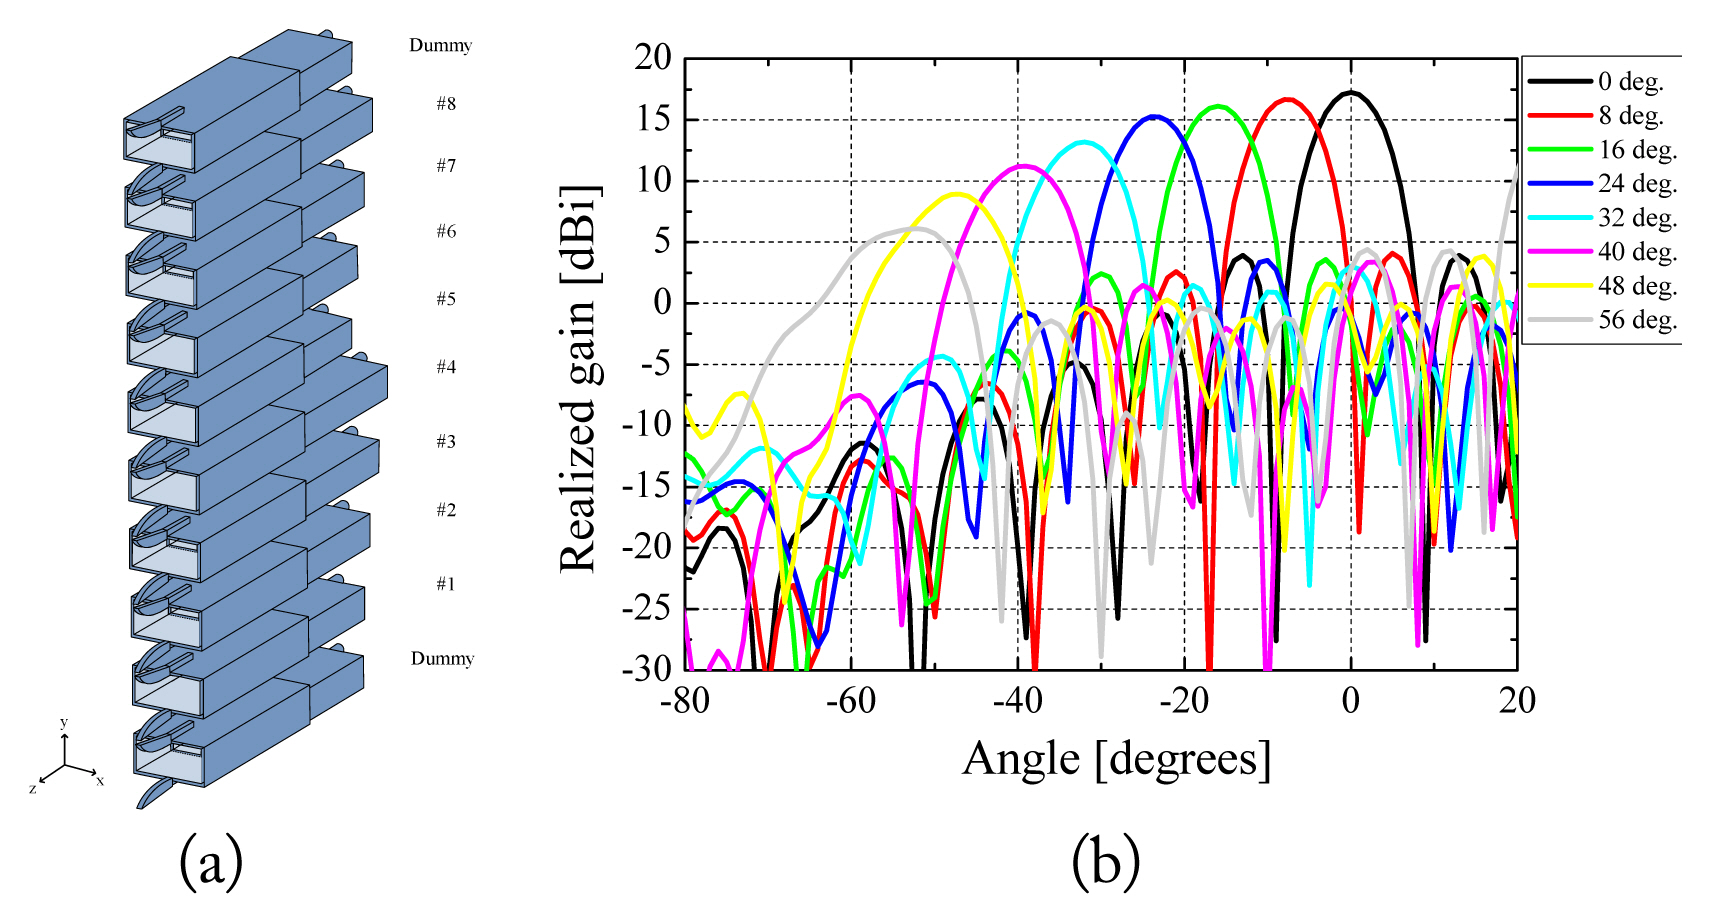
Fig. 5(a) presents a structure in which a total of eight antennas are arranged with an interval of 0.8λ (25.6 mm) to obtain an arbitrarily set E-plane beam width of 8°. The two antennas on the sides were used as dummies. The dummies render the mutual coupling characteristics of the antennas located in the middle and the antennas located at both ends the same. In addition, they make it possible to maintain the same radiation pattern for each antenna and provide protection against external shocks and undesired waves Fig. 5(b) indicates the mutual coupling characteristics between the array antennas. The characteristics of the edge antennas #1–#2 and the middle antennas #5–#6 are the same. Fig. 5(c) and 5(d) present the simulation results of S11 and E-plane radiation patterns of eight array antennas fed in the same phase, respectively. When the length “L” of the eight waveguide antennas was 140 mm (3.2λg), stable reflection coefficient characteristics were obtained. The −10 dB bandwidth (avg.) of each antenna was 1.59 GHz (17%). In the case of the E-plane radiation pattern, a maximum gain of 17.2 dB at 0° and a half-power beam width of 8° were obtained as designed.
An array antenna’s spacing of “d” was set for each antenna, and a phase difference for a desired beam steering angle can be obtained using kdcosθ + β (where k is wavenumber; d, antenna spacing; θ, angle between the antenna array axis and the beam-steering angle; and β, initial phase angle) [9]. For example, when the spacing of the eight array elements is 0.8λ, the beam width is 8°, and the maximum beam-steering angle is 16°. From the vertical axis of the array, each phase difference of the individual antennas can be derived. In this case, the free space wavelength λ and the tube wavelength λg were based on the center frequency of 9.375 GHz. If the phase difference between antennas is calculated to obtain the maximum directivity characteristic in the direction of 16°, 79.4° can be obtained. Thus, the phase difference of each individual antenna can be represented as indicated in Table 1. In addition, each phase difference was converted into waveguide’s length and expressed.
Fig. 6(a) presents an example of beam scanning by changing the length of the waveguide via sliding. The beam-steering angle was set from 0° to 56° at intervals of 8°; the beam-scanning radiation pattern is illustrated in Fig. 6(b). The maximum gain at 0° was 17.2 dBi, and as the scanning angle increased, the gain decreased, and the beam width became wider. This is because, as the beam scanning angle increases, the distribution of the antenna array decreases, and the gain of each element decreases.
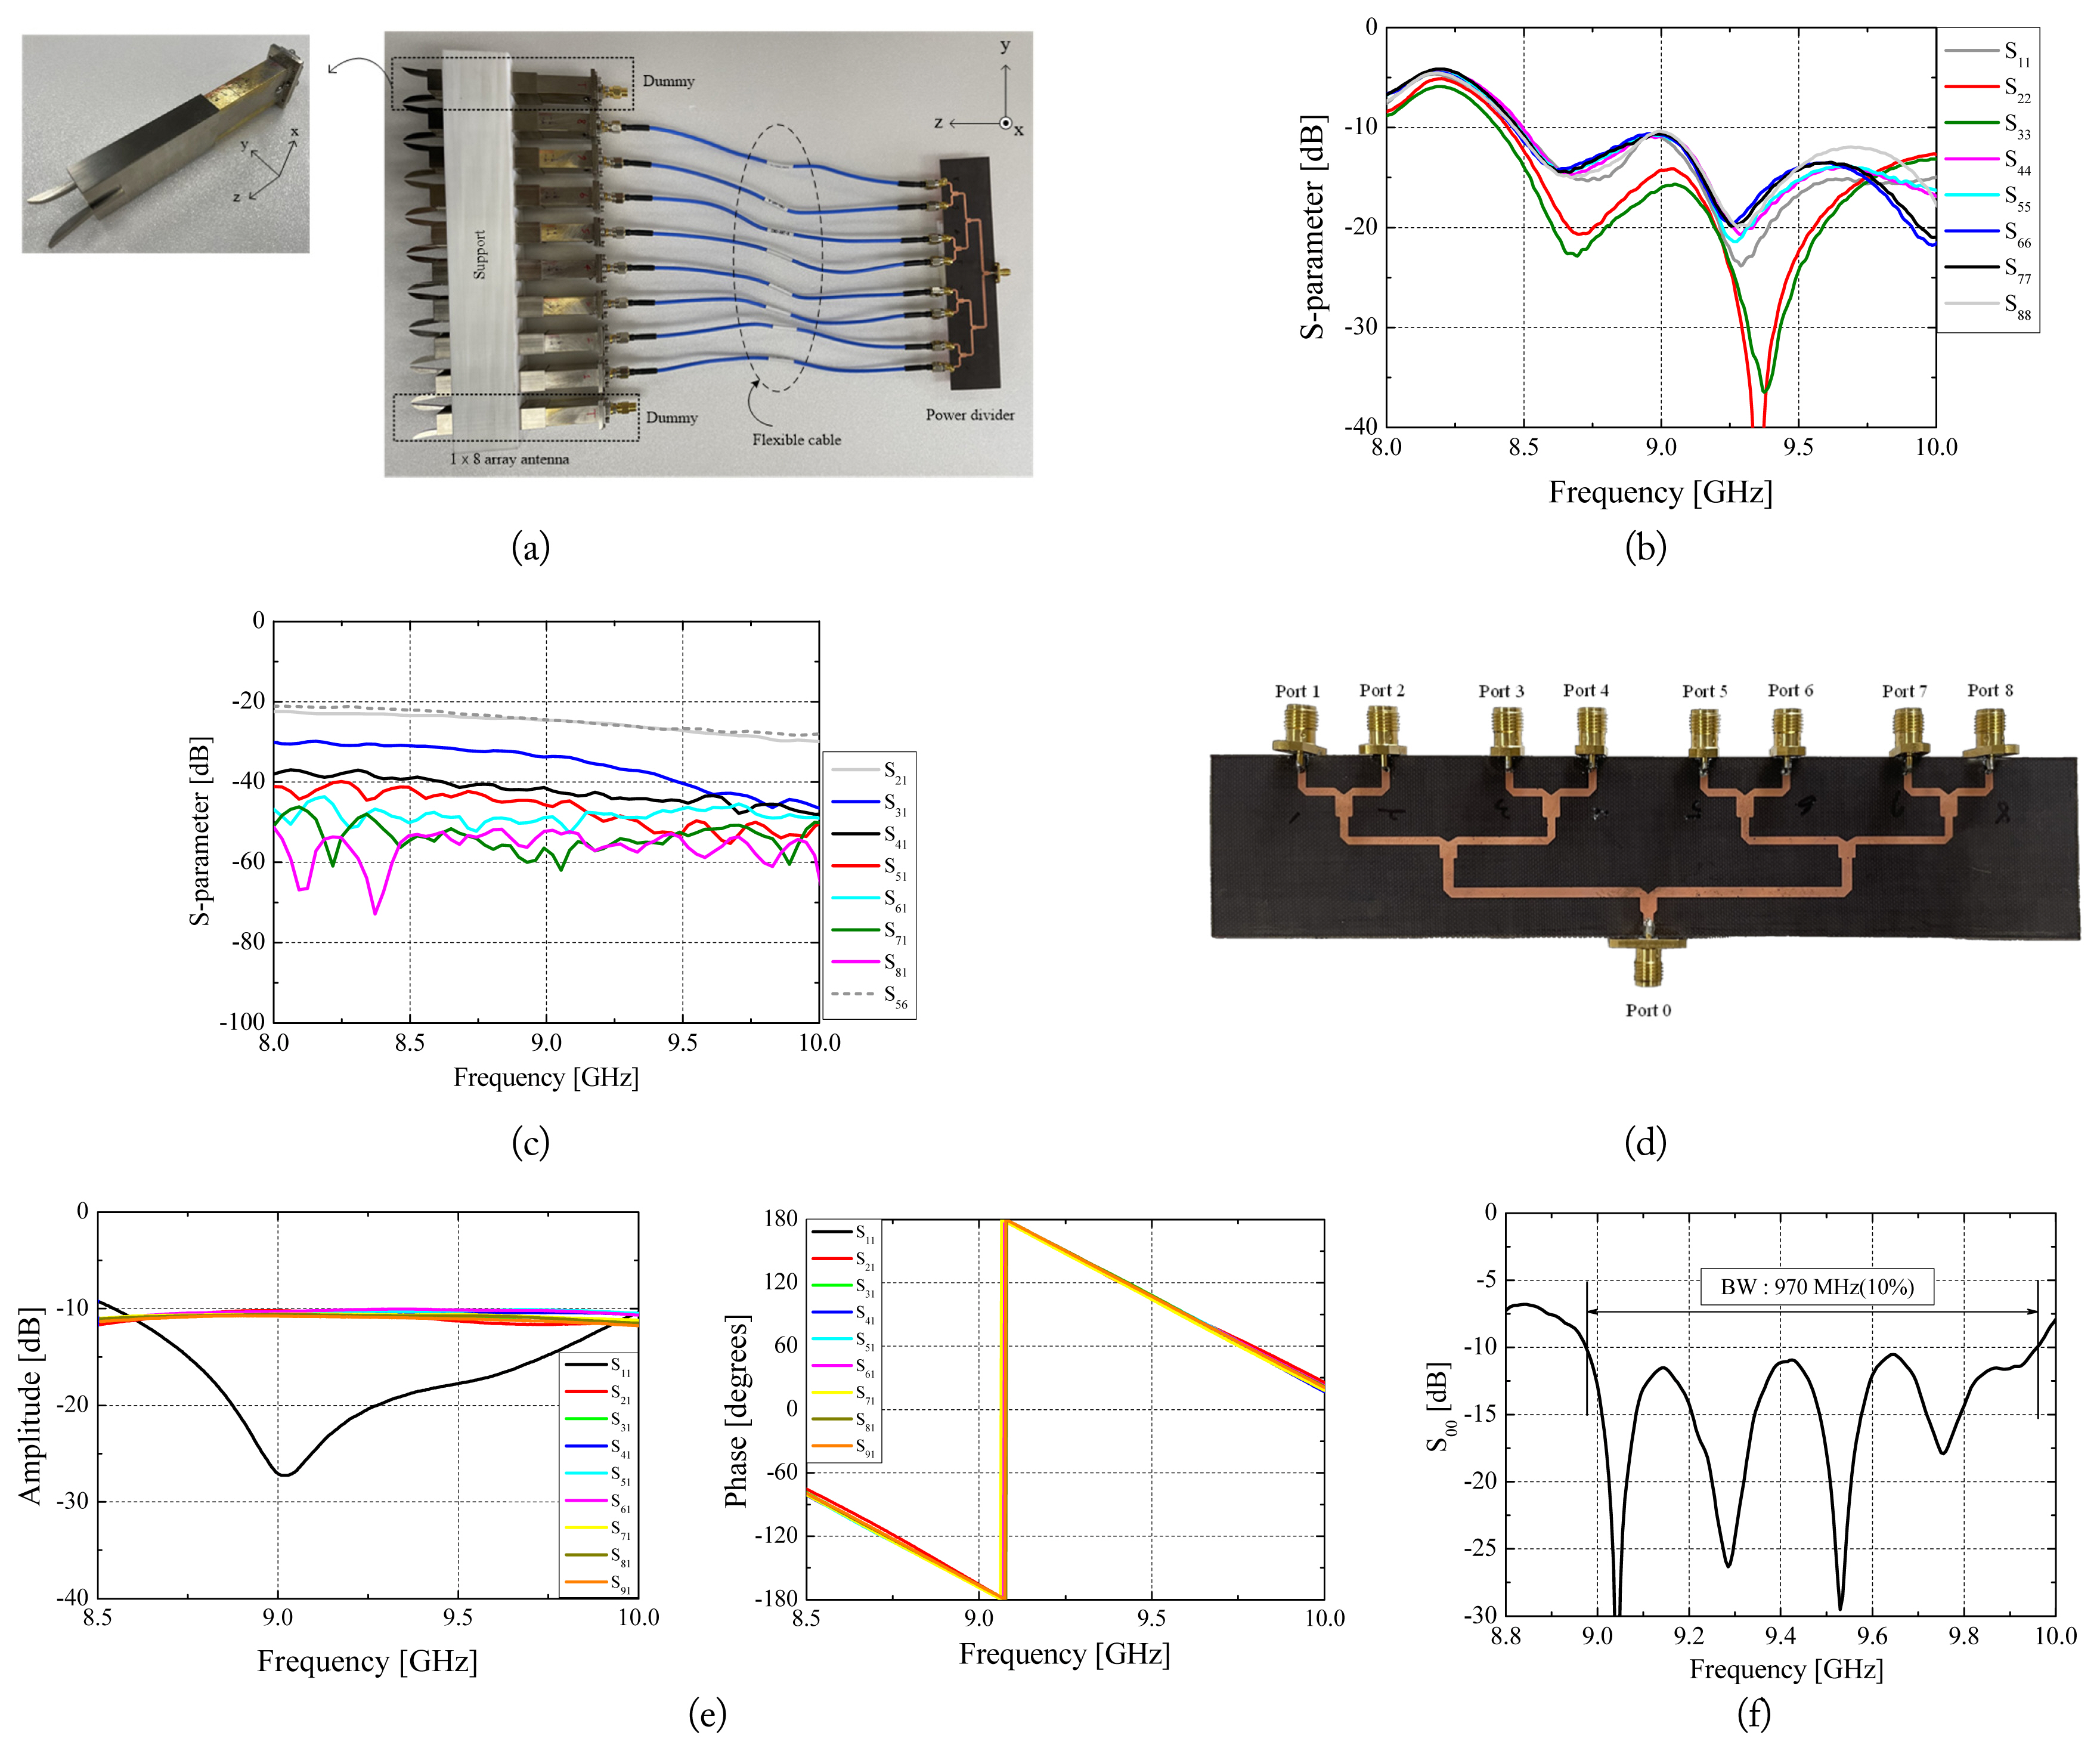
Fig. 7(a) shows the fabricated array waveguide antenna. Each waveguide antenna was arranged and fixed at a set interval of 25.6 mm. As indicated in Fig. 7(b), the reflection coefficient of each antenna presented stable characteristics. The −10 dB bandwidth (avg.) is 3.48 GHz (37.1%) in the design frequency band. Fig. 6(c) presents the measured mutual coupling characteristics between the array antennas. The results were also good agreement with the simulation results. A T-type 8-way power divider was designed for measurement, and the structure and measurement results are displayed in Fig. 7(c) and 7(d). The average loss of each port of the power divider is 1.62 dB. The cables and a power divider are connected to measure the beam pattern, as depicted in Fig. 7(a).
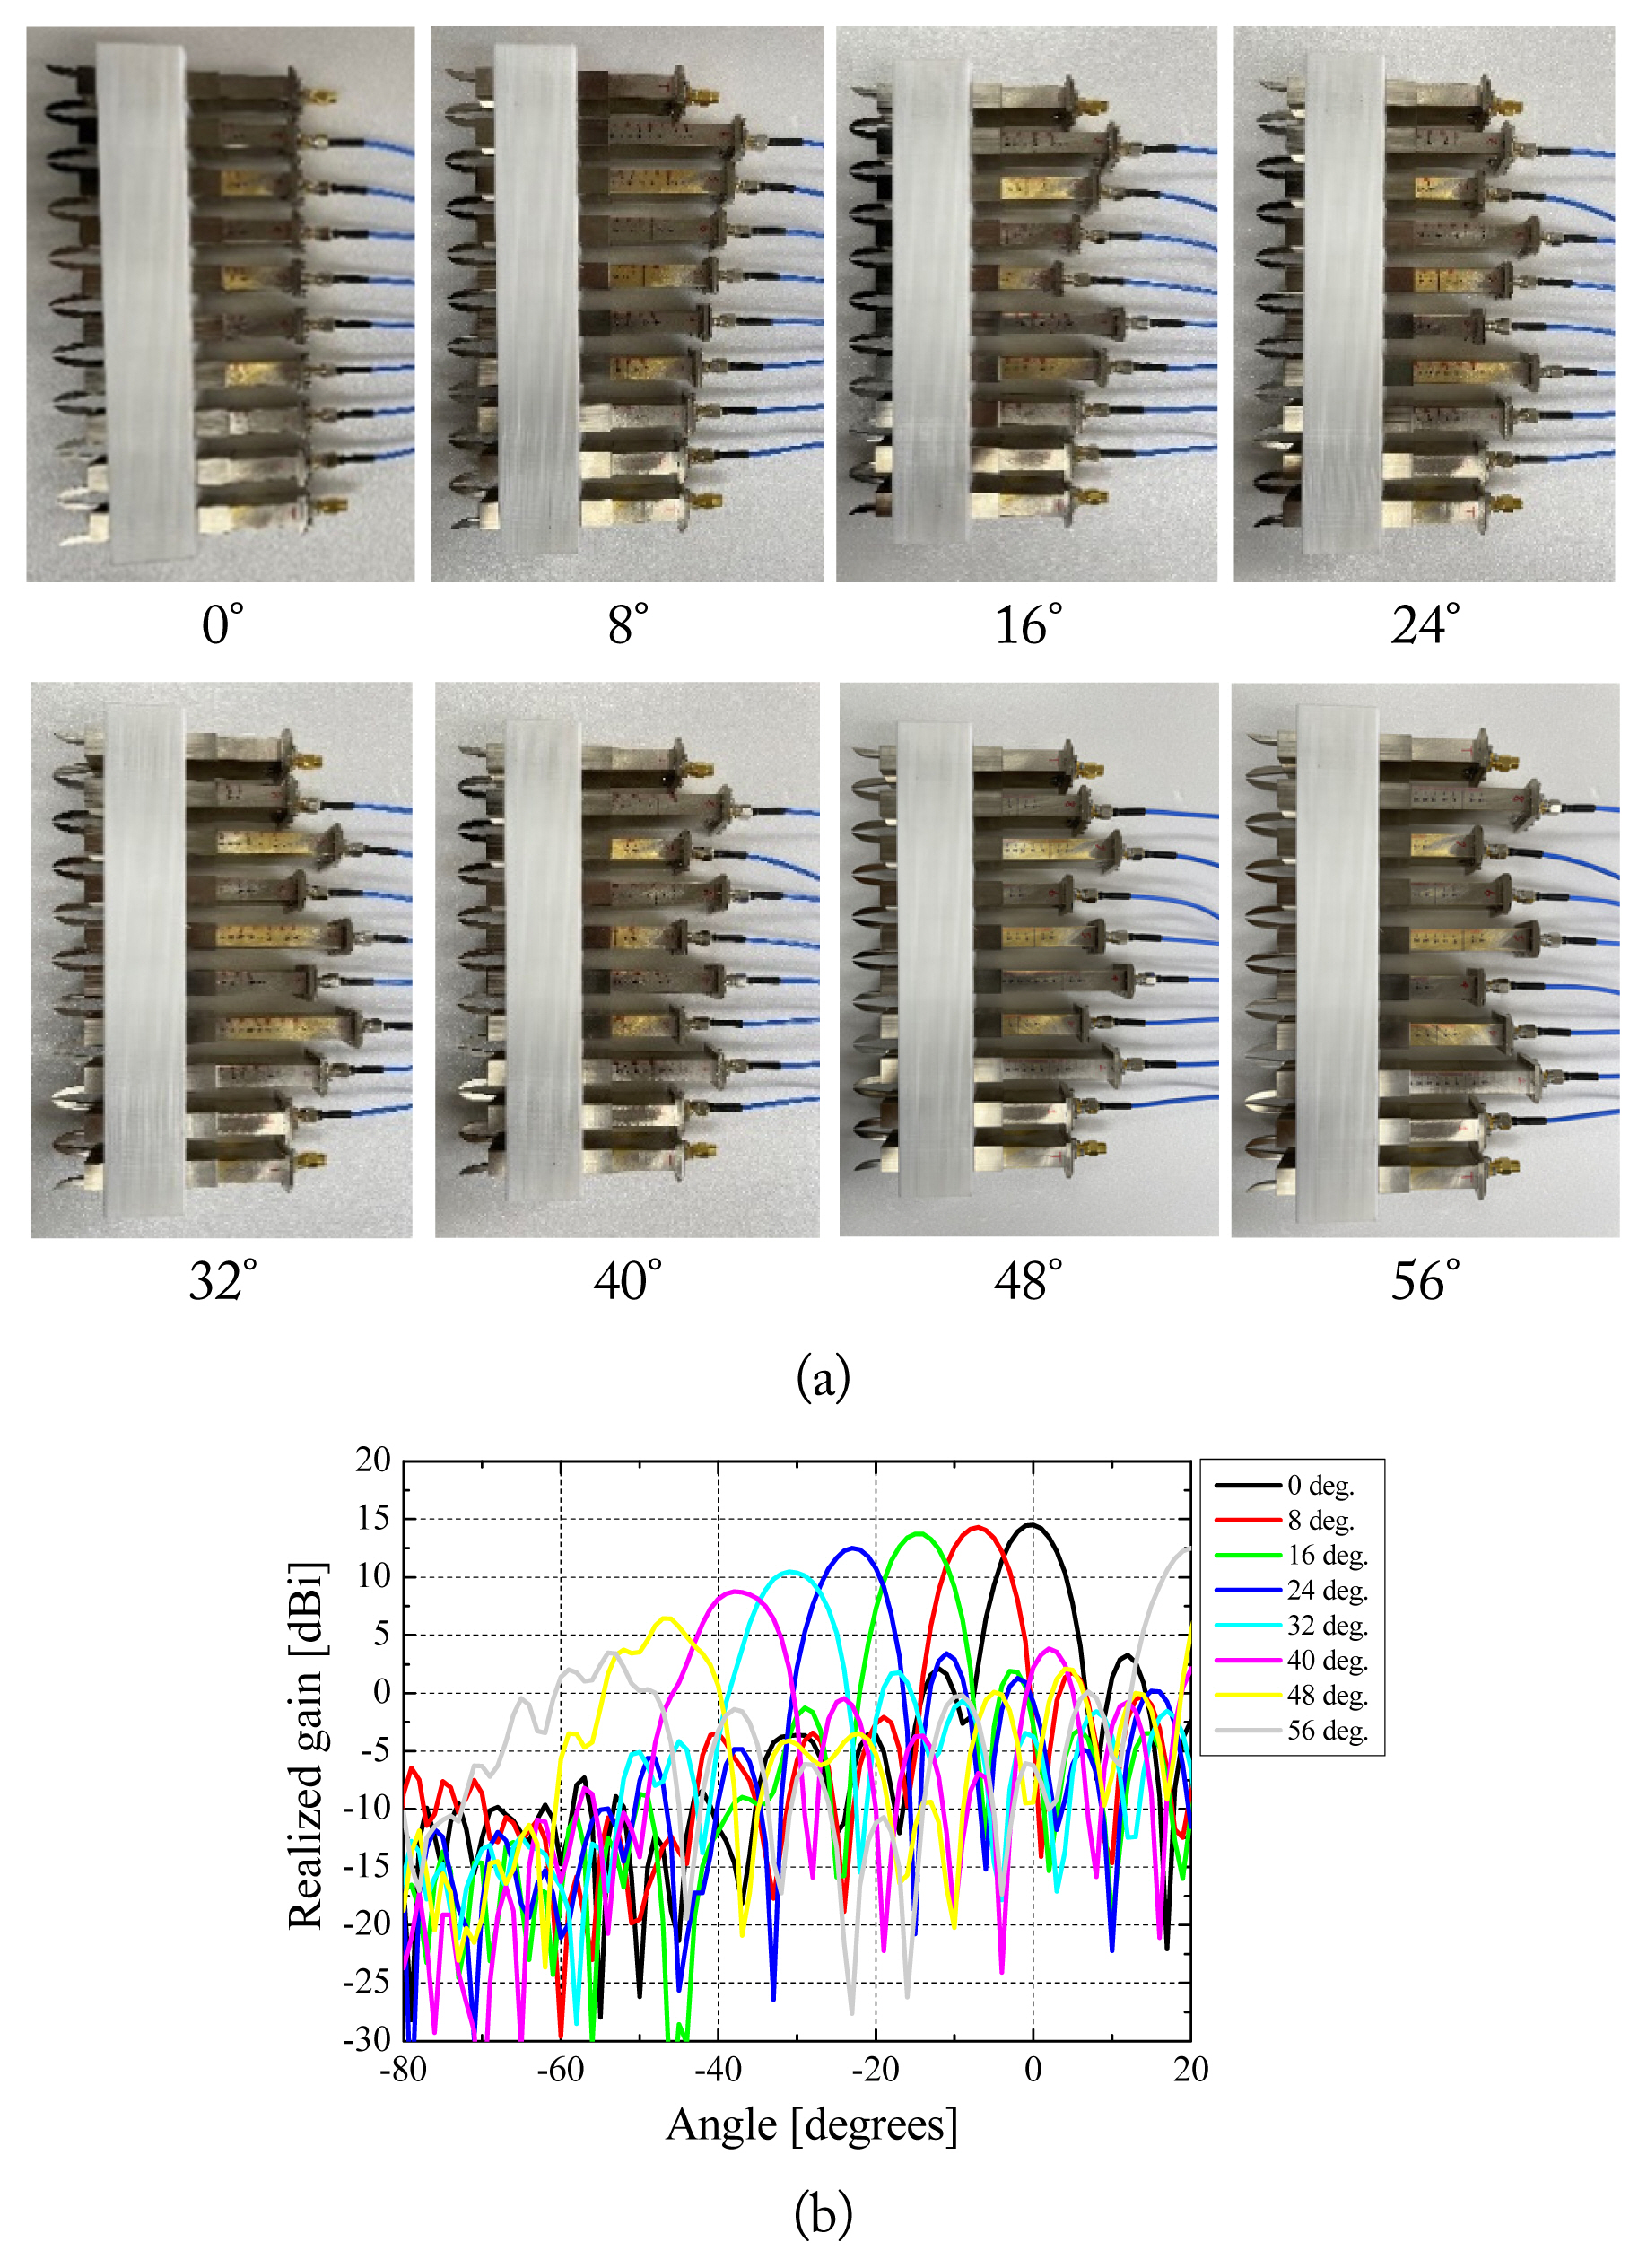
The flexible cable has been utilized so that when the length of the sliding waveguide is changed, the length of the waveguide can be flexibly adjusted. The eight cables have an average loss of 0.61 dB at a design frequency of 9.375 GHz. Fig. 6(e) shows S00 at the input port of the feed cable and the power divider connected to the 1 × 8 array antenna. The −10 dB bandwidth is maintained at 970 MHz (10.3%). To supply a phase difference to each antenna corresponding to the desired beam-steering angle, the length of each waveguide antenna was changed, as indicated in Fig. 8(a). First, when the same amplitude and phase were supplied to each waveguide antenna, the maximum gain at 0° was 14.5 dBi, as illustrated in Fig. 8(b). The 2.7 dB difference from the simulated gain can be attributed to the power divider, cable, and connector losses. The −3 dB beam width was 8°, and the beam was steered by 8° by adjusting the length of the waveguide. As illustrated in Fig. 8(b), the maximum level angle was steered by 8°.
As the beam-steering angle increased, the maximum level decreased, and the beam width became wider. This is because the array aperture appears smaller as the beam-steering angle increases. Additionally, when the beam-steering angle was greater than 48°, the grating lobe level was high. Accordingly, by adjusting the length of each waveguide through mechanical manipulation, it is possible to derive each phase difference to obtain the desired beam-steering radiation pattern characteristics.
III. Conclusion
In this paper, a sliding waveguide array antenna with beam-steering characteristics was newly proposed. The proposed antenna adjusts the phase difference of each antenna through mechanical rather than electronic manipulation. This function solves the problem of the vulnerability to EMP attack of the electronic beam-steering radar, which is generally mounted on ships or aircraft. First, the proposed antenna was designed to adjust the phase difference between the array antennas by changing the length of the rectangular waveguide using a slider at 9.375 GHz. Subsequently, to maintain stable reflection coefficient characteristics, a ridge structure was applied to the aperture of the rectangular waveguide to obtain a −10 dB bandwidth (avg.) of 1.58 GHz (17%). Finally, the eight rectangular waveguide antennas and two dummy antennas were arranged on an E-plane at 0.8λ (25.6 mm) intervals to obtain a beam width of 8°. The beam was then steered by 8° using each waveguide length adjustment. As a result, the beam width of −3 dB was 8°, and sequential beam-steering characteristics were obtained from 0° to 56°. These results indicate that the newly proposed sliding waveguide array antenna can steer the beam by mechanically adjusting the waveguide length. This newly proposed radar antenna technology can replace the electronic beam-steering radar, which is vulnerable to EMP attacks.