


I. Introduction
Target classification, which requires accurate radar echo signals from the target, is crucial to various radar missions. However, errors, such as radar clutter and signal processing errors, may distort the measurement data [1]. Hence, an efficient modeling and simulation (M&S) technique has been extensively used for a wide range of radar applications. However, accuracy in an M&S technique is difficult to achieve, particularly in the case of echo signals from dynamic radar targets. In this study, a commonly adopted algorithm for generating time-series echo signals [2] is statistically verified using a real measured dataset.
II. Simulated/Measured Data and Comparison
The measured radar cross-section (RCS) data of M107 projectiles fired by a 155-mm gun were collected by a weaponlocating radar developed by LigNex1. The radar frequency and polarization were the C-band and vertical polarization (v-pol.), respectively. Notably, the projectiles were fired at five different locations, with all cases having different trajectories, as seen in Fig. 1. The total number of trajectories was 229. As shown in Fig. 1, the measured dataset can be categorized into five groups.
Table 1 summarizes number of data points and the mean altitude for each group. Since the experiments were conducted in a mountainous area, the measured dataset was highly contaminated by returned signals from ground and volume clutters, such as a forested mountain and a cloud over a range. The trajectory of Case 1 exhibits the highest altitude and is also quite smooth, whereas that of Case 5 shows irregular patterns due to clutter effects. Table 1 lists the root mean square error (RMSE) between the measured and smoothed trajectories. As expected, this error decreases with an increasing altitude trajectory.
To calculate the time series of the received power for a dynamic target at a radar location, the method proposed by Rim and Koh [2] was adopted.
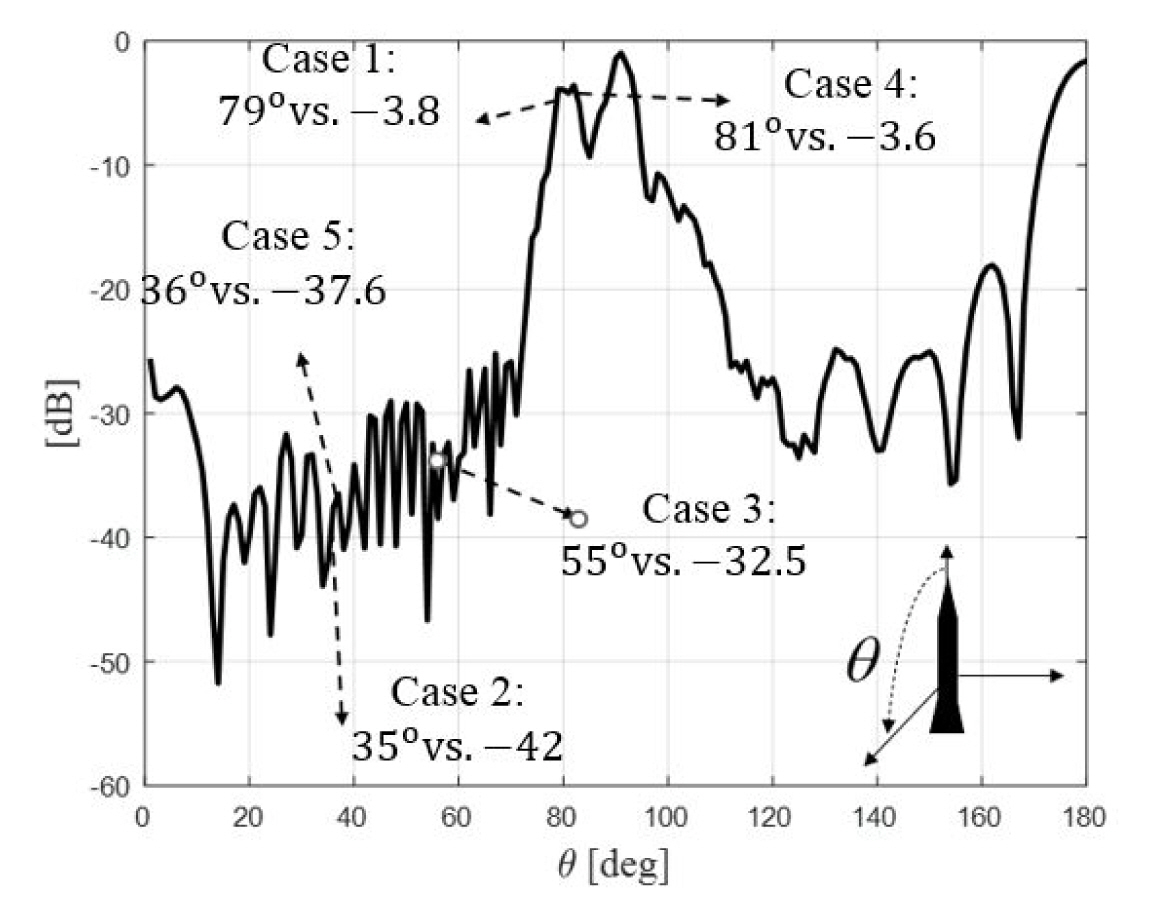
Since the experimental data provides only the position and RCS information of the target detected by the radar, the radar was positioned at the origin, and the rotation angle was calculated based on the position information of the target and the simulation. The frequency and polarization were C-band and v-pol., respectively, while the angle of attack was assumed to be 0º. Furthermore, the RCS of an M107 projectile was calculated over all incidence angles using shooting and bouncing rays. Among the four scattering amplitudes, Svv, depicted in Fig. 2, has a magnitude that is comparable to that of Shh, whereas the cross-polarization components Shv and Svh are very small (< −50 dB). Since the echo signal of a flying artillery projectile was calculated in an ideal scenario, clutter effects and signal processing errors, such as range gate straddling loss, were not considered. In addition, the antenna gain was ignored in conducting the following RCS calculation, as the target was located at the boresight of the antenna beam. A non-ideal scenario can be partially compensated by the signal processing loss (L), which is typically 3–6 dB [1]. To account for the full-polarimetric scattering by the target, the scattered field (E⃗S) was first calculated based on the four scattering amplitudes [2]. Subsequently, at each time sampling point, the RCS (σ) was estimated by the radar equation as
where λ, R, and ρ̂r are the wavelength, the distance between the radar and the target at each sampling point, and the radar polarization vector, respectively.
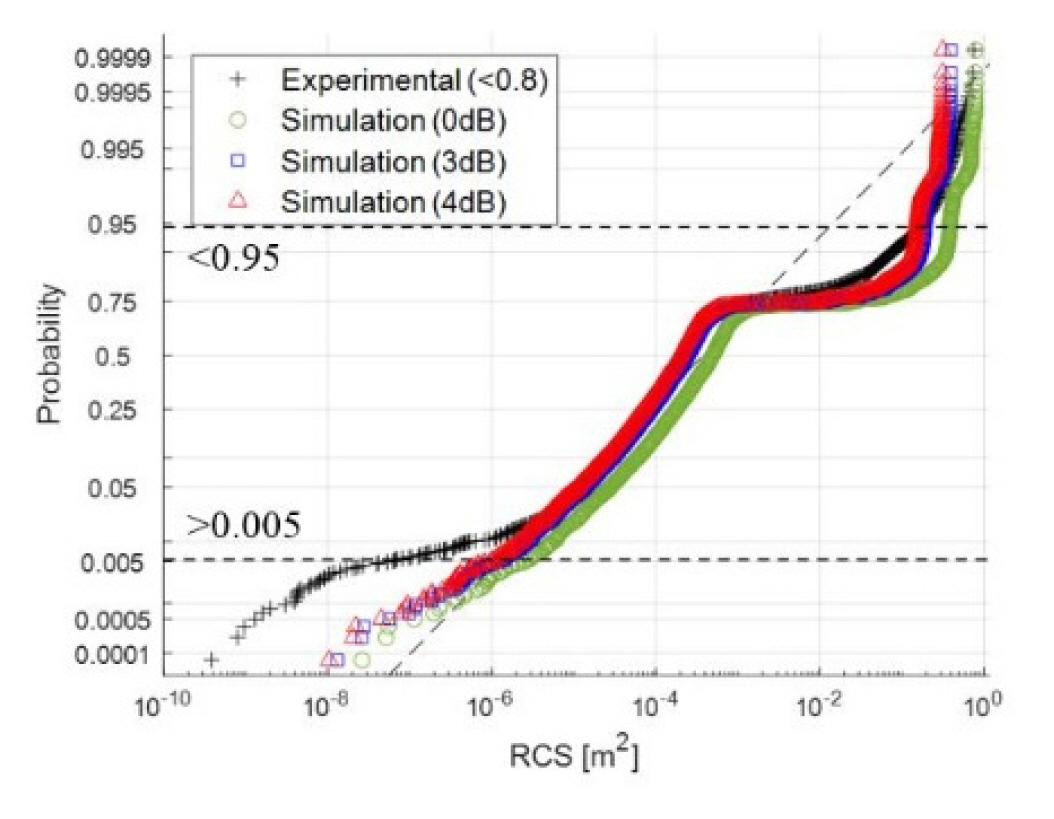
The number of data points in the measured RCS dataset was 7,077. Owing to the clutter, the measured RCS data might contain values that exceed the theoretically maximum value, which was 0.8 for this study. In the end, only 12 (0.2%) of the measured RCS data were >0.8. As a result, RCS values greater than 0.8 were removed from the measured dataset. In Fig. 3 and Table 2, “Experiment (< 0.8)” represents this modified dataset.
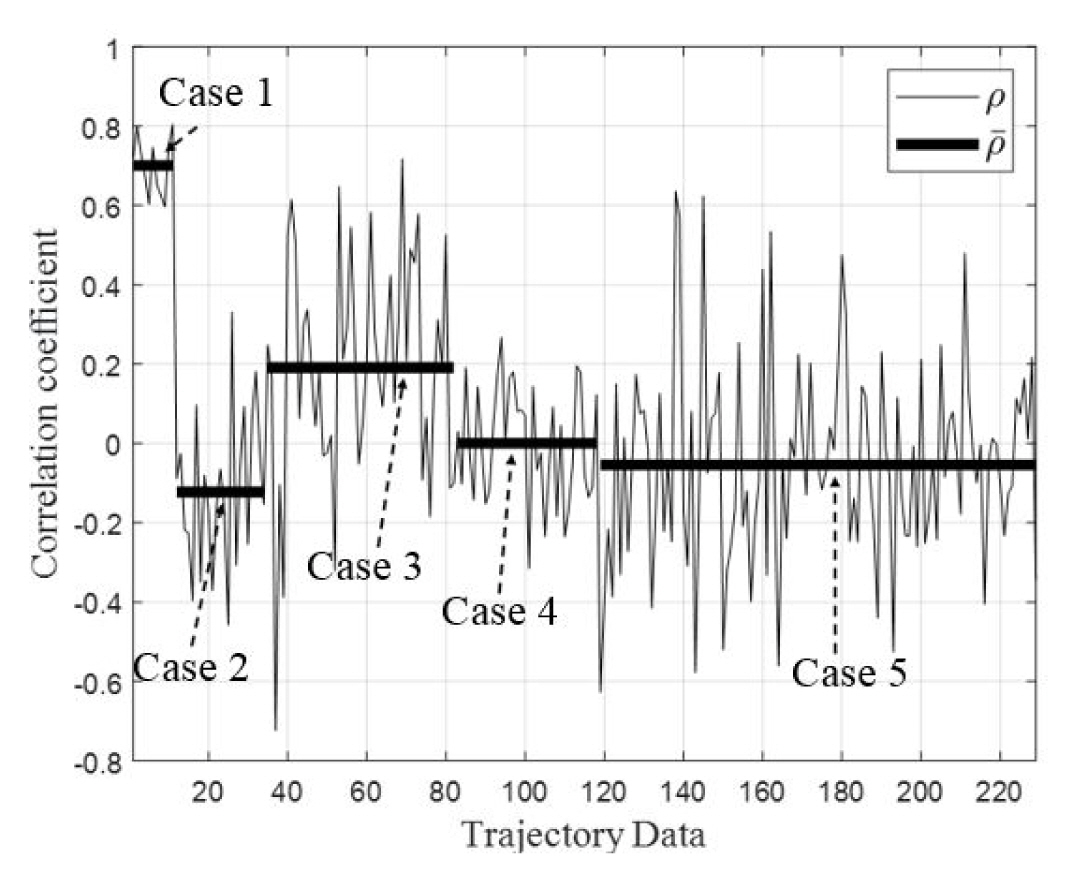
In conducting the comparison, the correlation coefficients (ρ) between the RCS time series of the experiment and the simulation were first computed. In this case, the stronger the correlation, the closer the ρ comes to ± 1 [1]. The ρ and its mean values (ρ̄) are presented in Fig. 4 and summarized in Table 1. Except for Case 1, low ρ̄ are observed for all the cases because clutter affects the measurement of a low altitude target significantly. Moreover, since the altitude of Case 1 is the highest, the clutter effect it encounters is the smallest, resulting in a high correlation. The altitude of Case 2 is the second highest, with its incidence angle (θ) on the target grazing with a median of 35º. The scattering by the target in Case 2 is much smaller than that in Cases 1 and 4, as seen in Fig. 2. This indicates that even small clutter scattering can significantly affect the accuracy of the final measurement. However, when the clutter effect is small, the simulation can provide sufficiently accurate time-series results.
Table 2 provides the mean and variance values of the original and modified measured data and simulation results, with L = 0, 3, and 4 dB. Since clutter and signal processing errors [1] are also considered in the measurement, accuracy could be improved by considering a loss of 3 or 4 dB in the simulation. To fit the measured dataset with the known probability density functions (pdf), an appropriate pdf was selected based on the Kolmogorov-Smirnov test. The modified dataset (S(x)) was fitted with four pdfs (P(x)) exponential, gamma, Weibull, and log-normal distributions to attain a positive random variable [3]. The maximum distance between the data and a fitted pdf was calculated as max|S(x) − P(x)| [3]. Subsequently, the pdf with the shortest distance was selected. Therefore, among the maximum distances of 0.69, 0.31, 0.21, and 0.16 obtained for the exponential, gamma, Weibull, and log-normal distributions, respectively, the log-normal pdf was used for the fitting. Fig. 3 compares the fitting of the modified and simulated results with L = 0, 3, and 4 dB, with errors identified in the low RCS values, possibly caused by the radar RCS estimation procedure. In this case, the comparison between the experimental and simulation results of the low and high RCS would be inaccurate because of clutter [2]. Therefore, 95% of the samples, which belonged to the 0.005–0.95 interval comprising 6,680 of the 7,065 samples were considered for comparison. In this truncated interval, the simulation could provide a highly accurate RCS pdf when considering the processing loss. The RMSE values between the fitted pdfs of the modified and simulated RCS over the truncated interval with L = 0, 3, and 4 dB were 0.1386, 0.0757, and 0.0685, respectively.
Since the accuracy of this simulation was high, other polarizations and frequencies were also simulated. Table 3 summarizes the mean, variance, and median values of the RCS for different radar polarizations and frequencies assuming L = 3 dB data that are useful for the classification of artillery projectiles [4]. Moreover, since the RCS of the target in the X-band is close to that in the C-band, the simulated values in Table 3 are very similar to those in the C-band. For example, the RMSE of the incidence angle against the Shh between the C- and X-bands is 0.0233.
III. Conclusion
The real radar measured and simulated RCS of M107 projectiles are compared in terms of their time series and statistics, such as mean, variance, and pdf. Radar clutter highly distorts measurement data, especially for low altitude targets. Furthermore, distortion is also caused by signal processing loss. To partially compensate for these measurement errors, a signal processing loss of about 3–4 dB was assumed, and about 95% of the RCS data with little clutter effect was considered for the comparison. The results showed that the statistics and time series produced by the simulation of the RCS were very similar to those reported in the experimental results. In addition, it is established that simulation is possible at various frequencies and polarizations since it exhibits high accuracy.