Deep Neural Network for the Behavioral Modeling of Memory Effects and Supply Dependency on 10-W Nonlinear Power Amplifiers
Article information
Abstract
In this paper, a deep neural network (DNN) model is proposed for the behavioral modeling of nonlinear power amplifiers with supply dependency. Although the conventional nonlinear model, such as the Volterra series, has high accuracy, it is not commonly implemented because of its complexity. However, with manageable complexity, the multidimensional input parameters of the proposed model ensure the modeling of the nonlinear behavior of power amplifiers with supply voltage dependency. The proposed model is trained by multi-tone signals on a 10-W power amplifier and validated by comparing the output spectrum and the third-order intermodulation (IMD3) of the model versus the measured data. The output spectrum shows less than 0.38 dB of error over a bandwidth of 10 MHz and input power from 11 dBm to 17 dBm, and the IMD3 error is less than 0.1 dB over the output power range.
I. Introduction
As wireless communications are being developed to embrace massive transceiver units for better network performance, high peak-to-average power ratio (PAPR) signals are applied to power amplifiers (PAs).
As a result, nonlinearity and memory effects lead to spectral expansion and deteriorate the adjacent channel power ratio performance. To solve these problems, digital predistortion (DPD), backoff operation, and many linearization techniques have been introduced [1–4].
In particular, in the case of DPD, its performance varies greatly depending on the accuracy of the model. Therefore, accurate nonlinear modeling of PAs is a prerequisite. In many cases, the Volterra series provides a generalized mathematical model with memory [5]. However, to represent an accurate nonlinear model, the depth of memory must be deep, which requires a large number of parameters. In other words, it can achieve limited performance in terms of bandwidth and nonlinear effects. Although the Wiener–Hammerstein model has been proposed to relieve the problem with fewer parameters than the Volterra series, it still requires many variables and has limited performance [6, 7]. Therefore, the traditional nonlinear model requires a large number of parameters and a long extraction time. To supplement these points, a modeling method using an artificial neural network (ANN) has been proposed [8].
To achieve an accurate model, a growing body of research has explored nonlinear modeling based on ANN.
However, studies on the modeling of PAs using ANNs mainly deal with sophisticated model structures and show only input and output power dependency [9, 10]. However, to implement a nonlinear model that is applicable to practical systems, such as envelope tracking, power/voltage dependency must be considered.
In this paper, based on deep neural network (DNN) architecture, we propose an accurate behavioral model of PAs with strong nonlinearity with bias dependency and memory effects. The performance was verified by comparing the third-order intermodulation (IMD3) and spectral responses of the measurement and model output.
II. DNN Modeling
Fig. 1 is a simplified diagram of the modeling system.
Block diagram of the modeling system.
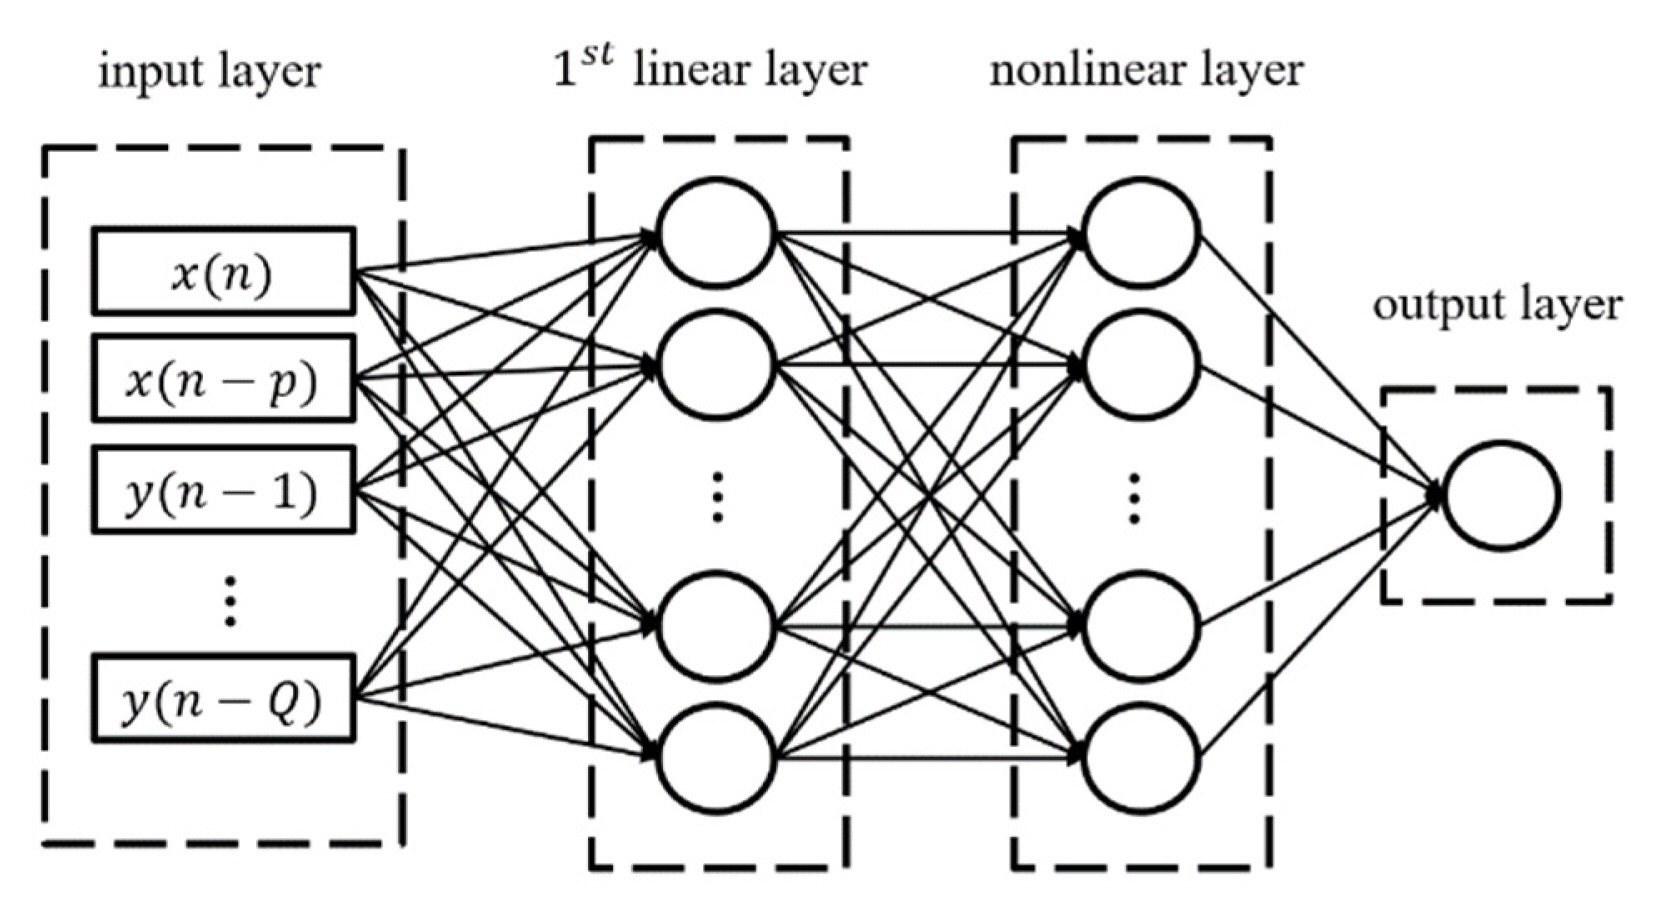
The PA system assumes a low pass (Fig. 2). To consider the memory effect of PAs that causes the asymmetry of IMD, a memory polynomial is required. As the system includes delay tabs for a long-term memory effect, it has a structure similar to that of a finite-impulse-response (FIR) filter. In Fig. 2, x(n) and y(n) are defined as the input and output signals that measure the PA system, respectively. ŷ(n) represents the output of the desired model. x(n) and y(n) can be written in (1) as follows:

A fully connected two hidden layers artificial neural network (FC2HLANN)-based model structure.
where f(·) is the nonlinearity of PA, and Q is the memory depth [9].
e(n) is a cost function, a difference between the actual values y(n) and ŷ(n). y(n) is a complex signal and is expressed as (2). e(n) is defined as shown in Eq. (3) [11].
where n is the number of total data.
A basic modeling system was used to minimize e(n) to find ŷ(n) most similar to y(n). In this case, the DNN structure was selected as an algorithm for determining y(n).
To optimize ŷ(n), the optimal gradient was determined by the stochastic gradient descent method, which is defined in (4) as follows:
The method does not utilize all data but rather relies on a uniform, randomly chosen example from the data to calculate the predicted slope for each step. This method can obtain the optimal gradient faster than gradient descent.
However, the vanishing gradient problem occurs as the depth of the model increases. Backpropagation is the process that calculates a target value and an output of the prediction model in the forward direction and then propagates the error to update the weight of each node, as shown in (5) and (6. This can resolve the vanishing gradient problem.
S is a function expressing the node, ω is the weight of each node, and x is the input data.
The local gradient of each node obtained in the forward progression is used to calculate the differential value to be obtained in the backward progression. By using the stored global gradient, it is possible to obtain the partial differential loss value with respect to x.
For the structure of the model, a fully connected two hidden layers artificial neural network (FC2HLANN) is adopted [9], as shown in Fig. 2. The corresponding structure works in such a way that the previous sample y(n) of the output signal is supplied back to the input layer through the buffer. Here, Q denotes the number of neurons in the layer representing the memory depth attributed to the output signal. The long short-term memory (LSTM) structure is chosen to contain the nonlinearity of the PA. The LSTM is a model that can perform cyclic structures for a long time. It has strengths in sequential and iterative data learning. Unlike DNNs, which send an input through an activation function in the hidden layer to output, LSTMs have characteristics in which a previous output is passed as an input to the computation of a node next to the hidden layer. Using this circular structure, past learning is reflected in present learning through ω. This algorithm resolves the existing limitations of continuous, iterative, and sequential learning data.
The number of neurons in the hidden layer is determined as Q + 1. If the number of neurons in the hidden layer is insufficient, the accuracy of modeling by DNN is underestimated. Conversely, as the number of neurons increases, noise may be included, or overfitting may occur. In other words, it is not always true that performance improves when the memory depth increases and the number of neurons increases. In this paper, a structure with four neurons is used: Q = 4 [9].
As the existing DNN structure depends on the relationship between the input and output signals of the device under test (DUT), two hidden layers are used to achieve strong nonlinearity while maintaining a correlation between the input and the output. The linear layer is used to approximate the feedback FIR filter. The second layer is used for the static nonlinearity approximation of the transistor, and the number of neurons is determined by the static nonlinearity of the PA. A hyperbolic tangent is used to express this, as shown in (7).
To represent the model dependency on supply voltage, a multidimensional modeling structure was adopted. Fig. 3 shows the model structure used for multi-dimensional modeling. In this paper, drain voltage and input power are given as additional inputs for multi-dimensional modeling.
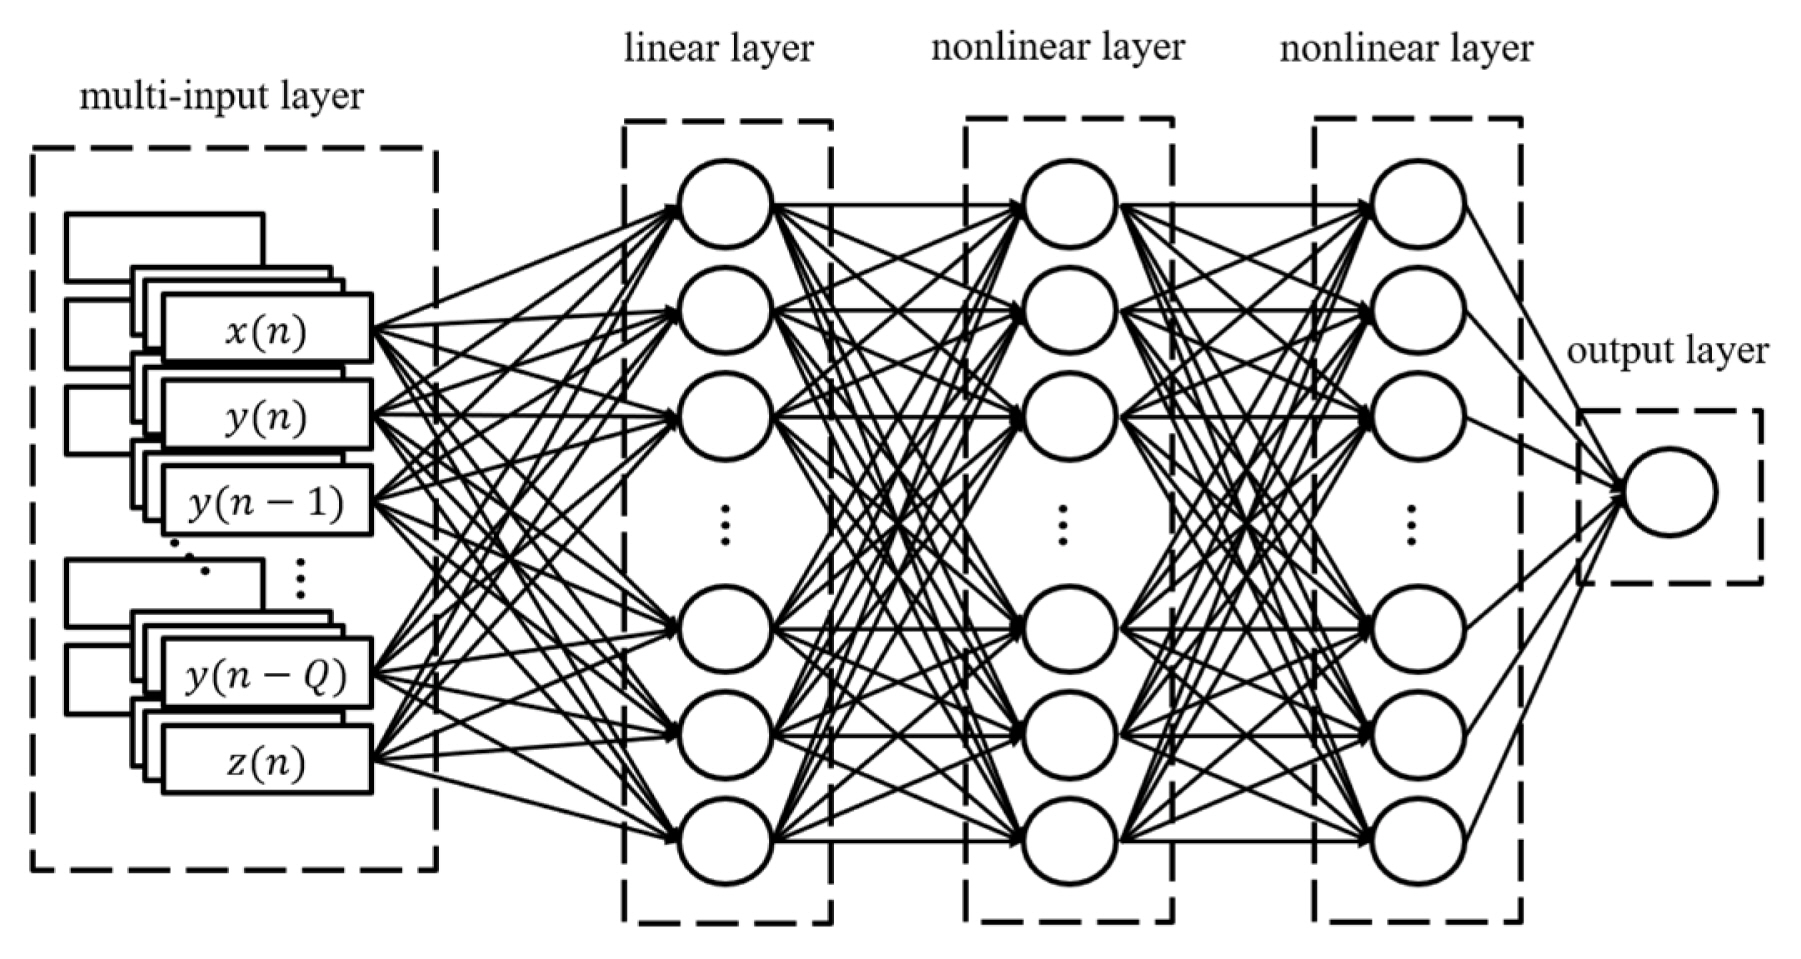
Multi-input model structure.
In Fig. 3, z(n) represents the normalized drain voltage between −1 and 1. The input power is implemented as an additional dimension. In the existing input type, a length equal to the input level is added.
As the dimension increases, the third nonlinear layer is added to increase learning accuracy.
III. Measurement
To represent the high PAPR of the latest communication signals, a phase-distributed 4-tone was used, with a center frequency of 3.5 GHz and a bandwidth of 4.5 MHz. The envelope of the signal was digitized. The data sampling frequency was 10 GSa/s, and training was performed using 300,000 samples in one dataset. The test set comprised 100,000 data. Fig. 4 shows the measurement setup. A multi-tone signal was generated with an input level of −10 dBm by a Universal Software Radio Peripheral. The signal was fed into a 10-W GaN PA from Cree with a 17-dB gain. Afterward, the input and output were digitized using a high-speed oscilloscope.
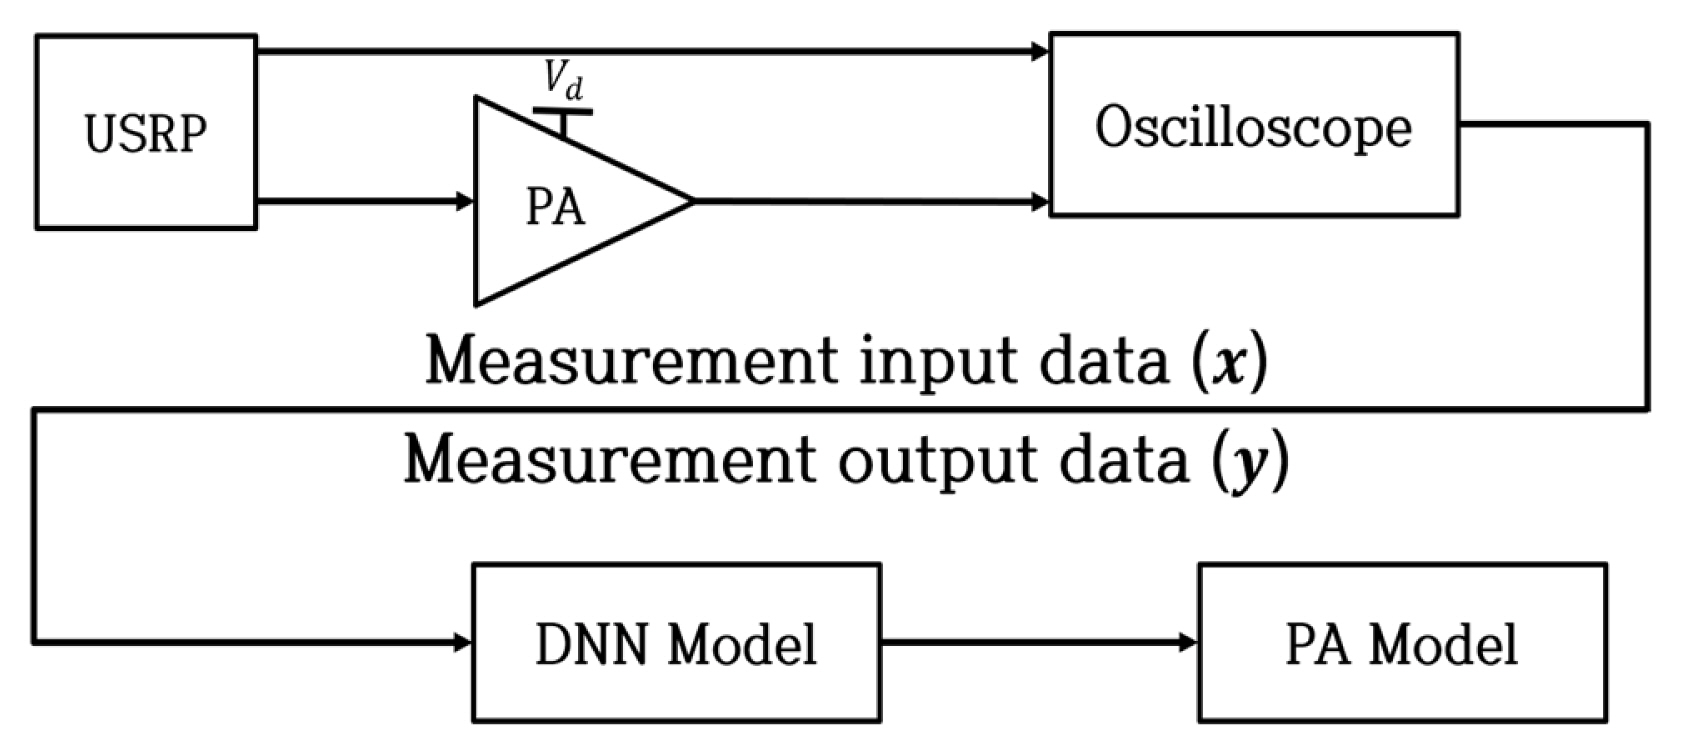
Measurement setup.
IV. Modeling Results
Fig. 5(a) shows the nonlinearity of the DNN model and the PA. Strong nonlinearity is observed from the model and the PA output, confirming that the model successfully represents the nonlinearity of the PA. In Fig. 5(b), the measured PA and DNN model outputs are compared, showing that the model accurately follows the PA output. Fig. 5(c) is the fast-Fourier-transform (FFT) result presented to confirm the memory effect of the PA through the asymmetry of IMD3. This confirms that asymmetry exists between the right and left of IMD3, which are −32.15 dBc and −31.55 dBc, respectively. Fig. 5(d) shows the normalized amplitude modulation/phase modulation (AM/PM). Fig. 5 clearly shows that the DNN model successfully models the memory effect in the PA.
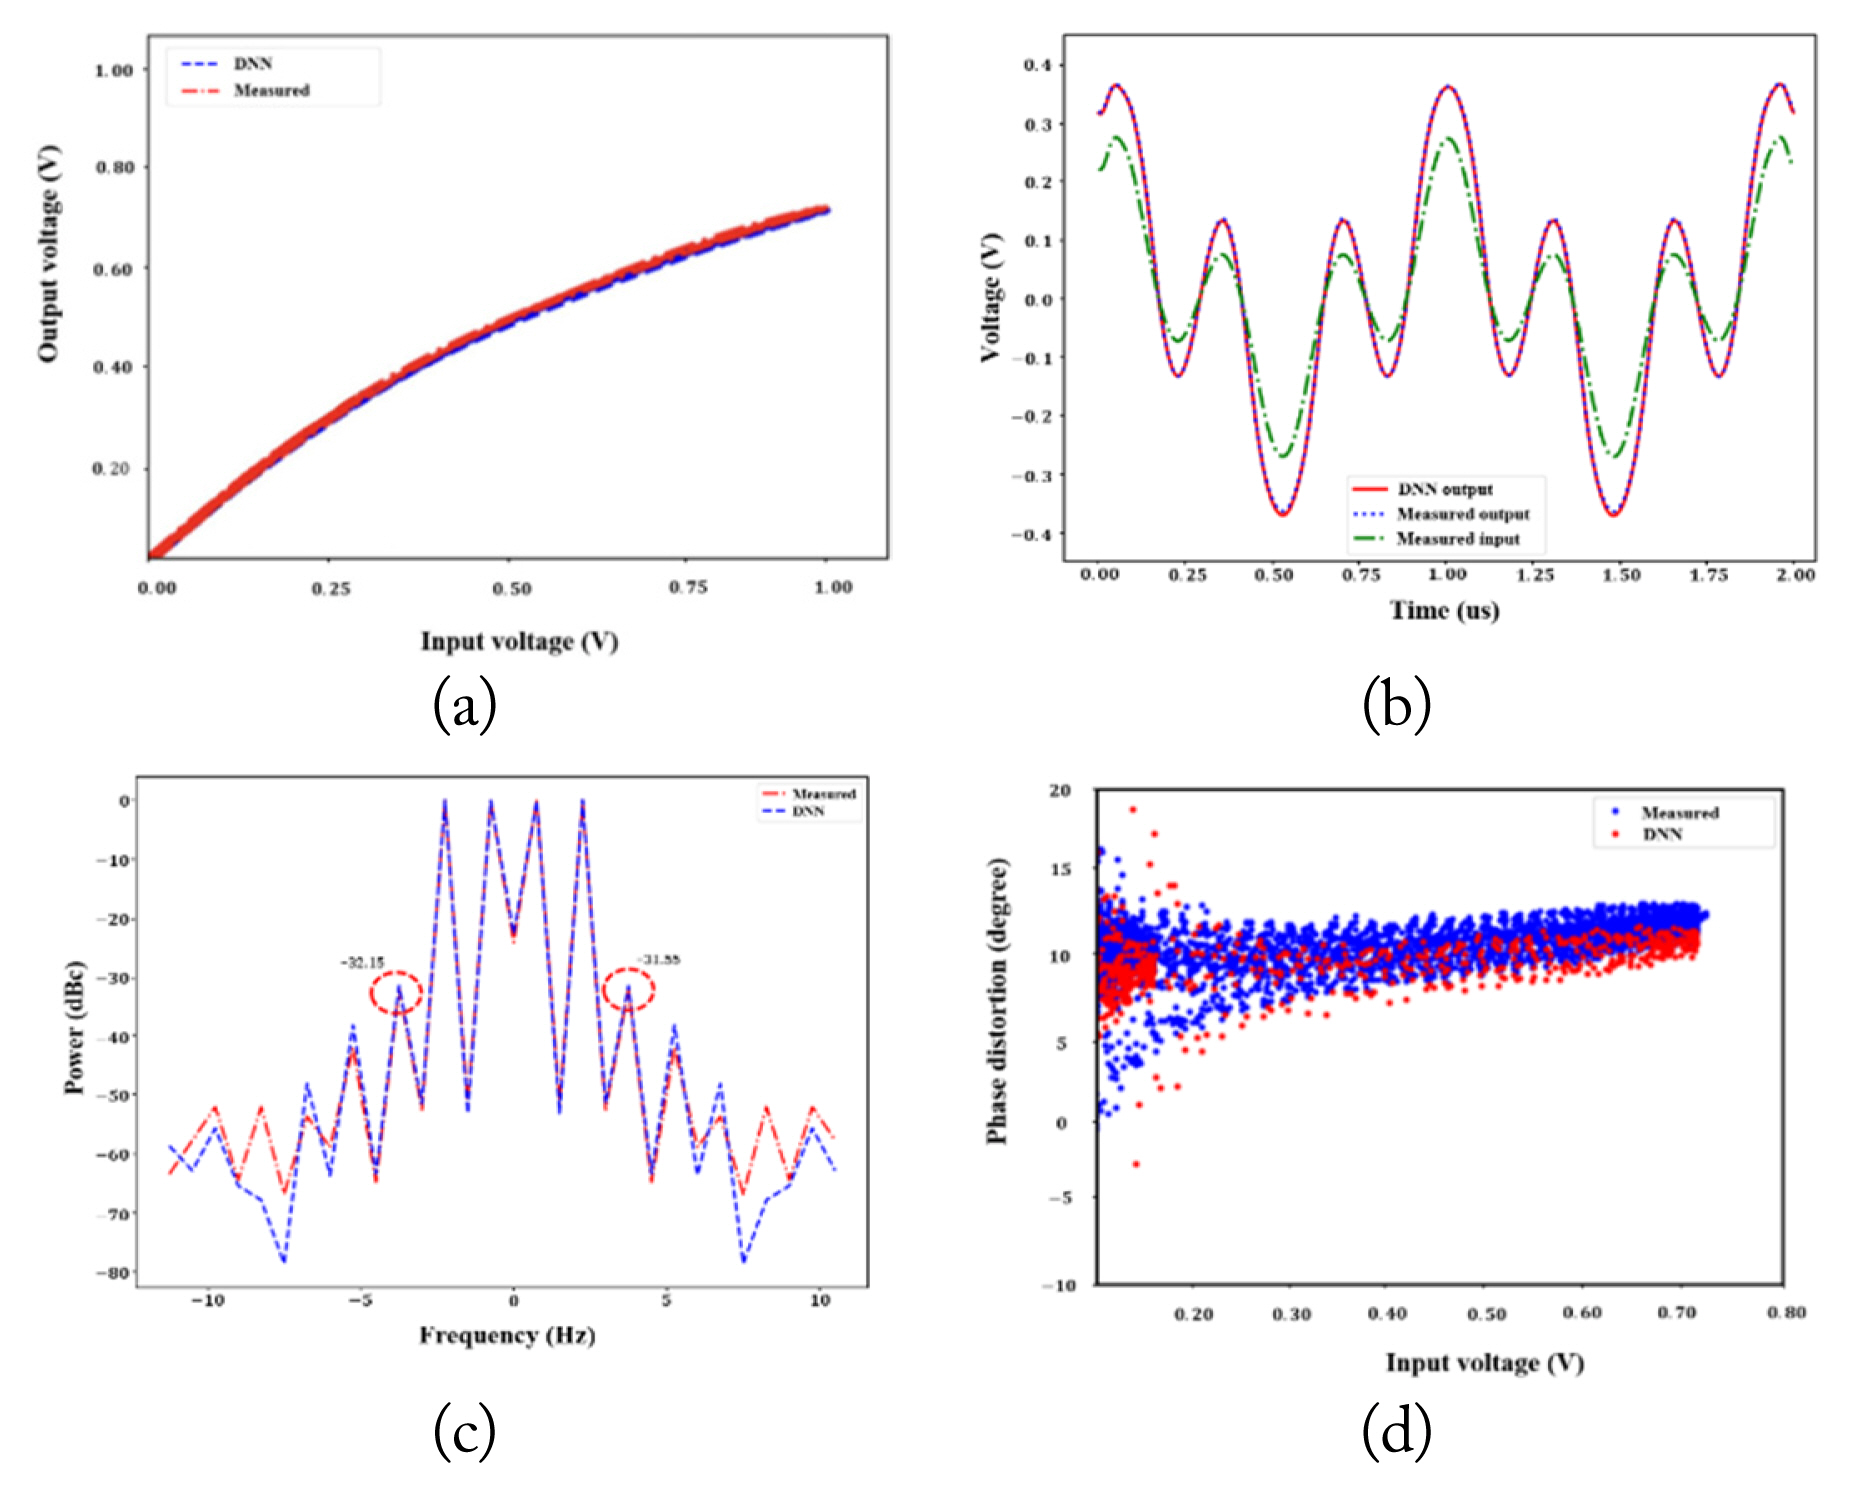
Modeling with 4-tone and 28 V supply voltage: (a) normalized measured and DNN model AM/AM, (b) time domain waveforms of the input, PA output, and the model output, (c) IMD asymmetry of the of model and the measured output, and (d) normalized measured and DNN model AM/PM distortion.
Fig. 6(a) shows the normalized measured and DNN model AM/AM with a drain voltage of 28, 27, and 26 V. Fig. 6(b) depicts the multidimensional multi-tone measured and DNN model AM/PM distortion. Fig. 6(a) and 6(b) show the results at the fundamental carrier frequency. Baseband modeling is performed after down-conversion, as shown in Fig. 6(d). The sampling frequency was 150 MSa/s. Training was performed using 8,192 samples in one dataset, and the test set comprised 8,192 data. Fig. 6(c) and 6(d) show the training performance of the model with drain voltage. Fig. 6(c) and 6(d) show the memory effect, while Fig. 6(c) shows the measurement output and the model output with a multi-dimensional multi-tone signal.
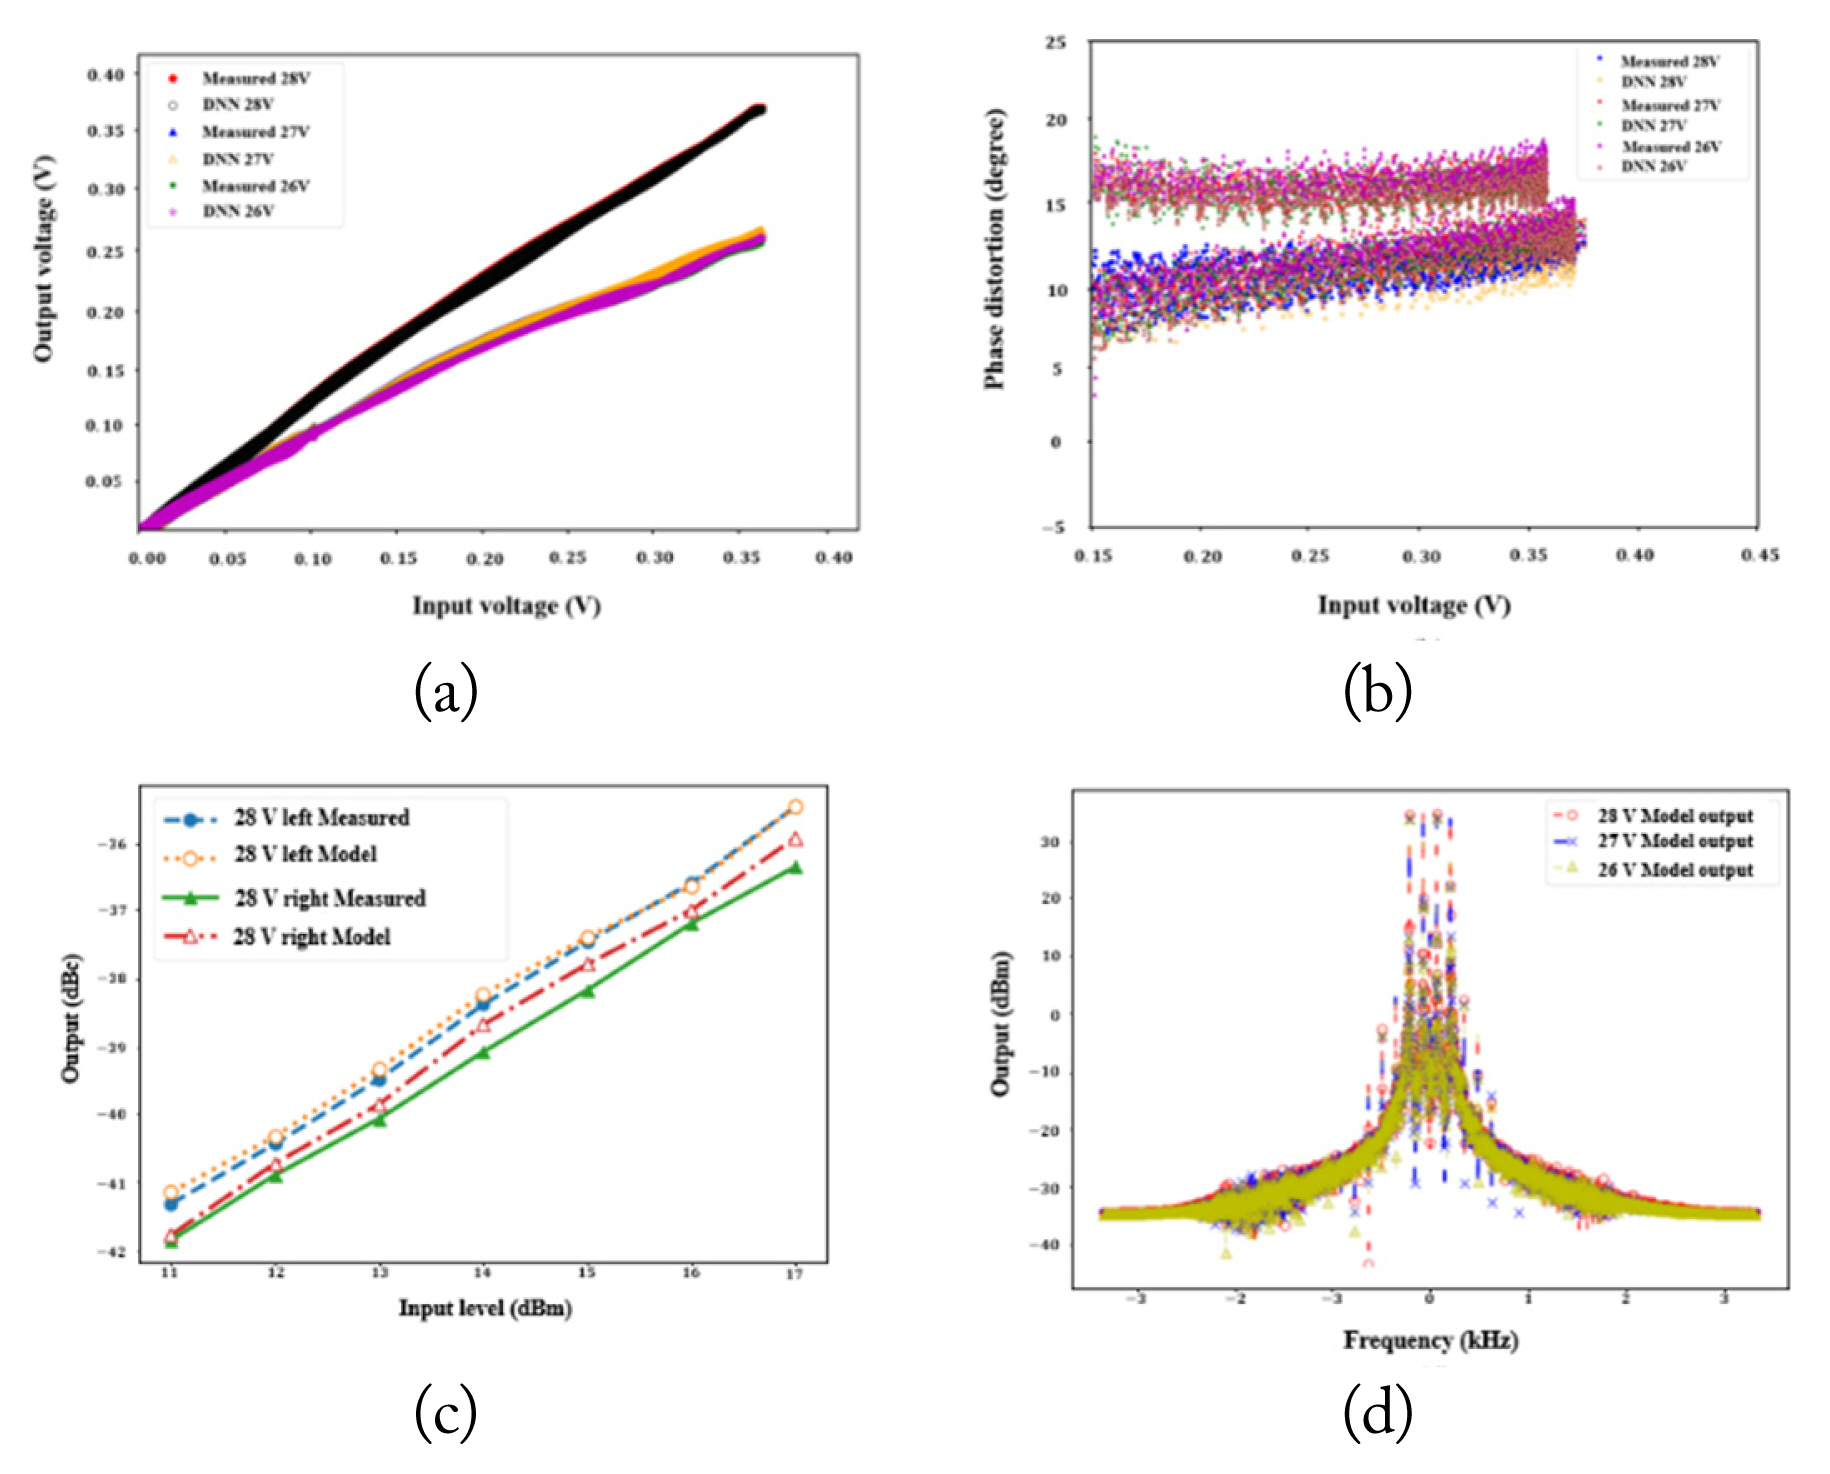
Modeling of memory effects and drain voltage dependency: (a) normalized measured and DNN model AM/AM, (b) normalized measured and DNN model AM/PM distortion, (c) IMD3 of the model and PA, and (d) baseband spectrum of the model and PA with VDD = 26, 27, and 28 V.
V. Conclusion
In this paper, a multi-dimensional deep learning model of nonlinear PAs with memory effect bias dependency is proposed. The model was trained by multi-tone waveforms into a 40-dBm GaN PA. The modeling confirmed that nonlinearity was accurately modeled and that the IMD3 result showed a memory effect within a 0.1-dB error over the entire output power range. Moreover, the proposed multi-dimensional model was verified to show the dynamic nonlinear behavior of the PA with respect to the drain voltage variation. Thus, we successfully implemented an efficient nonlinear PA model with memory effects using a deep learning model with optimized hyperparameters.
Acknowledgments
This work was supported by the Research Fund of Hankuk University of Foreign Studies, the National Research Foundation of Korea grant funded by the Korean government (MSIT) (No. 2020R1F1A1073315), and the Electronics and Telecommunications Research Institute (ETRI) grant funded by the Korean government (No. 22HH4200, Study on the measurement techniques of electromagnetic material property at sub-THz frequency band).
References
Biography

Mihyang Kang received her B.S., and M.S. degree in electronic engineering from Hankuk University of Foreign Studies, Yongin, Korea, in 2020. She is currently working at the Satellite Systems Research Institution in LIG Nex1. Her research interests include satellite communications, high-power RF power amplifiers, deep learning, and behavioral modeling.

Sieon Lim received his B.S. degree in electronic engineering from Hankuk University of Foreign Studies in Yongin, Korea, in 2021, and he is currently working toward his M.S. degree at Hankuk University of Foreign Studies. His research interests include analog circuit design, RFIC design, high-power RF power amplifier, and behavioral modeling.

Youngcheol Park received his B.S. degree in electrical engineering from Yonsei University, Seoul, Korea, in 1992, and his Ph.D. degree in electrical engineering from the Georgia Institute of Technology, Atlanta, in 2004. He is currently a professor at Hankuk University of Foreign Studies in Yongin, Korea. From 1994 to 2007, he worked with Samsung Electronics, Korea, where he designed mobile handsets. His research interests include high-efficiency power amplifiers, behavioral modeling of nonlinear parametric devices, and calibrating test equipment.