


I. Introduction
Partial discharges (PDs) are electrical sparks that occur inside insulation between two conducting electrodes. This phenomenon causes physical damage to the insulator inside a power transformer and seriously degrades the performance of the transformer. Therefore, the localization of PD signals is critical to maintain the insulation condition of high-voltage insulation systems. The ultra-high frequency (UHF) technique is a useful method to detect PD signals [1ŌĆō3]. One advantage of this technique is that it is less susceptible to external environments and is less affected by external noise compared to the ultrasonic method. A distributed array of UHF PD sensors is used to detect PD signals simultaneously, and the localization of PD signals can be estimated using the time difference of arrival (TDOA) between electromagnetic (EM) signals captured by the sensor array.
EM propagation from a PD source is very complicated due to multiple reflections inside a power transformer. Therefore, an accurate estimation of the TDOA is essential for precise localization of the PD source. Four methods are commonly used to estimate the TDOAŌĆöthe first peak method [4], the cross-correlation method [5], the energy criterion method [6], and the average time window threshold method [7, 8]. In practice, PD signals received by UHF sensors are usually contaminated by unwanted signals, such as digital radio signals, thermal noise in detection systems, and telecommunication signals. These noise degrades the accuracy of estimating the TDOA and therefore may result in a false PD location.
The purpose of this work is to determine a robust method of accurately ascertaining the TDOA of PD signals in the presence of noise. As stated, UHF signals captured by PD sensors have complex waveforms due to non-line-of-sight (NLOS) propagation. Therefore, a full-wave EM analysis method is required to accurately obtain UHF signals emitted from PD sources. Of the many EM analysis methods, this study employs the finite difference time domain (FDTD) method because of its versatility, robustness, and accuracy [9ŌĆō13]. In contrast to the method of moment [14] and the finite element method [15], in the FDTD method it is not necessary to perform the inverse Fourier transformation to obtain time-domain EM signals to estimate the TDOA.
II. Numerical Simulaion
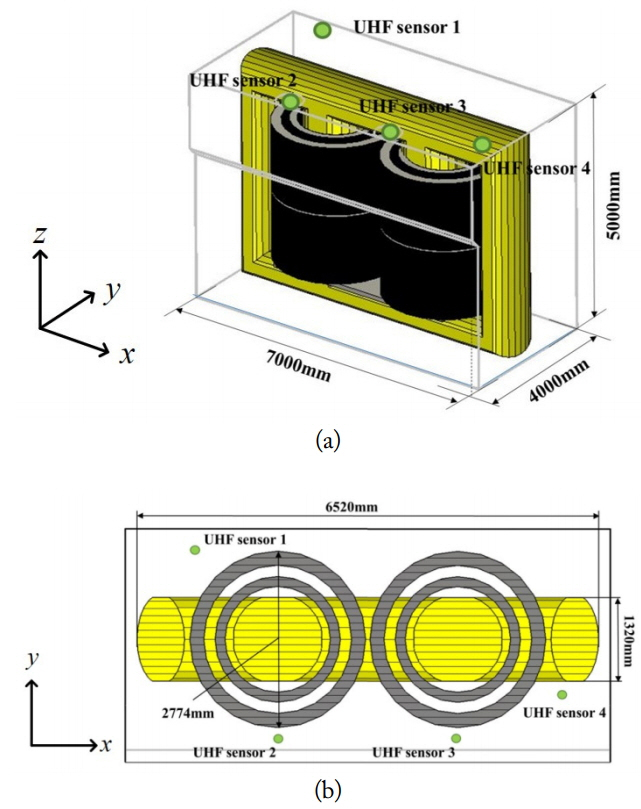
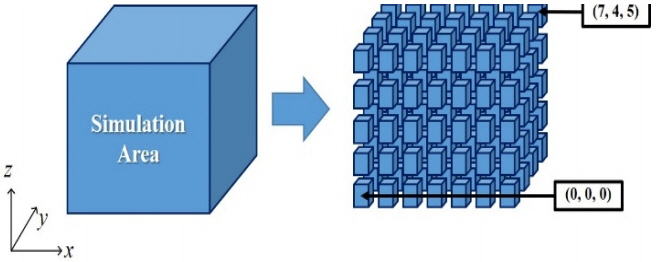
Numerical simulation of UHF signal propagation from a PD signal in an actual oil-immersed power transformer that is 7,000 ├Ś 4,000 ├Ś 5,000 mm3 in volume is performed using the CST Microwave Studio time-domain solver, which is based on FDTD. The transformer configuration is shown in Fig. 1. The transformer mainly consists of an iron core, a coil, and a tank. The iron core and coil are colored yellow and grey, respectively, in Fig. 1. The tank is used to hold oil and to isolate components from the external environment. The dimension of the tank is the same as the simulation area. The diameter of the coil is 2,774 mm, and the width and length of the core are 1,320 mm and 6,520 mm, respectively. All components are set as perfect electric conductor in the FDTD simulation. The PD signal is modelled with an exponential function [1]. Note that the dielectric constant of oil was measured using an Agilent 85070E dielectric probe kit and an 8719ES network analyzer and was determined to be 1.7. In this work, we simulate many scenarios by changing the location of a PD source. To this end, the transformer structure is divided into 140 (7 ├Ś 4 ├Ś 5) subdomains, as shown in Fig. 2. The dimension of each subdomain is 1,000 ├Ś 1,000 ├Ś 1,000 mm3. The PD source is placed at the center of each subdomain, and then 80 scenario simulations are performed by changing the PD source position. The last 60 scenarios are excluded because each center of the 60 subdomains is enclosed or located in windings and iron core.
III. Numerical Results
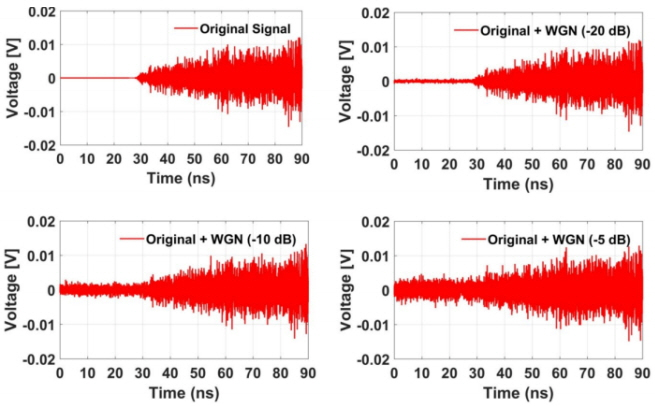
In the power transformer tank, the localization of the PD source can be estimated using the TDOA between EM signals captured by the UHF PD sensor array. Usually, four methodsŌĆöthe first peak method, the cross- correlation method, the energy criterion method, and the average time window threshold methodŌĆöare used to estimate the TDOA. In an actual power transformer environment, the main cause of TDOA errors is noise. Therefore, we investigate the influence of noise on the arrival time of UHF signals. In this work, white Gaussian noise (WGN) with three different intensities is used. In this work, signals with a signal-to-noise ratio (SNR) of ŌłÆ5 dB, ŌłÆ10 dB, and ŌłÆ20 dB are used. Fig. 3 shows the time-domain PD signals received at UHF sensor 1 with and without noise when the PD source is located at P1. The power of the PD signal in Fig. 3 was ŌłÆ38.95 dBm, and power of the noise was set to ŌłÆ43.95 dBm, ŌłÆ48.95 dBm, and ŌłÆ58.95 dBm for the SNRs of ŌłÆ5 dB, ŌłÆ10 dB, and ŌłÆ20 dB, respectively. To evaluate the robustness of each method, the noise-added PD signals are compared with the original PD signal.
1. First Peak Method
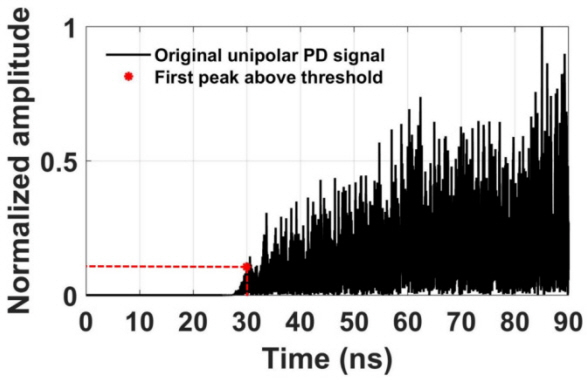
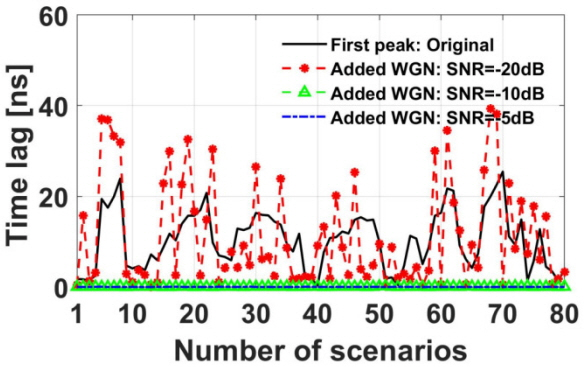
In the first peak method, the arrival time of UHF signals is defined as the first occurrence of a peak whose signal amplitude exceeds a specific threshold. The threshold value chosen is arbitrary and depends on visual inspection to determine the first peak. In this work, 10% of the normalized PD signal was chosen as the threshold value. Fig. 4 illustrates how the first peak method determines arrival time from the received signal. The time difference of the PD signals was calculated using the first peak method for 80 scenarios. Fig. 5 shows the results of the first peak method between the signal captured by reference sensor 4 and that captured by sensor 1 (i.e., TD14). When the stronger noise (SNR = ŌłÆ10 dB and ŌłÆ5 dB) are added, the time lags show nearly 0 seconds in Fig. 5, as the level of the first peaks is smaller than the noise level (refer to Fig. 3). Table 2 shows the average error of arrival time difference versus the SNR for the first peak method. Note that the first peak method is not at all robust against noise.
2. Cross-Correlation Method
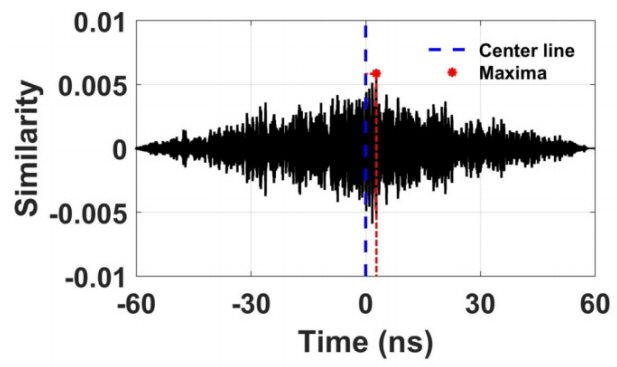
The cross-correlation method is used to find the similarity of two received UHF signals. This method gradually shifts the reference signal over the others to find a matching signal. The cross-correlation value is maximum when signals are most comparable to each other. The cross-correlation is defined as [5]:
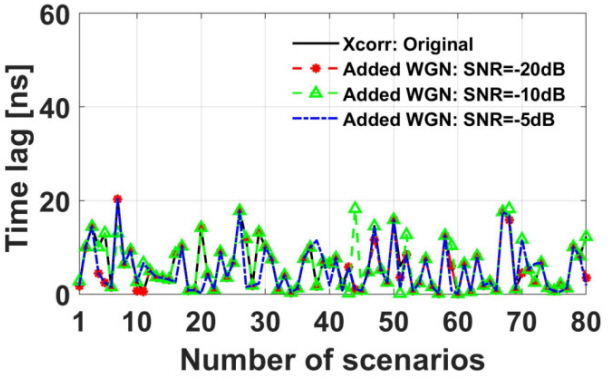
where N is the total number of data points. The maxima will not be located at the center of the similarity graph when the signals are not identical. Fig. 6 shows how much the maxima far from the center line represents the TDOA between two sensors. Fig. 7 shows the result of the cross-correlation between the signal captured by reference sensor 4 and that captured by sensor 1 for 80 scenarios. Table 3 shows the average error of arrival time difference for the cross-correlation method. The cross-correlation method is not particularly robust against noise.
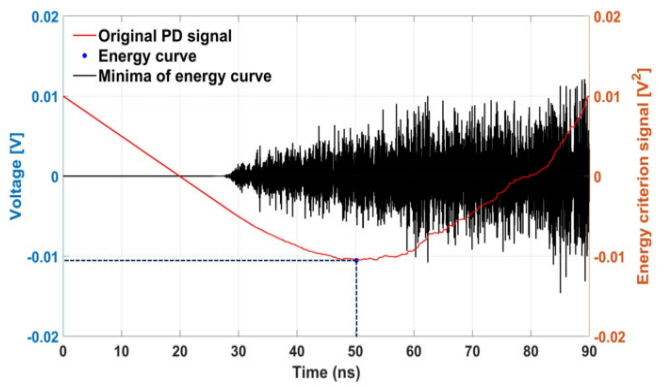
3. Energy Criterion Method
The energy criterion method is based on the energy content of the signal, and the energy criterion signal is defined as [6]:
where N is the total number of data points and
╬╗ = Ōłæ i = 1 n v i 2 / N
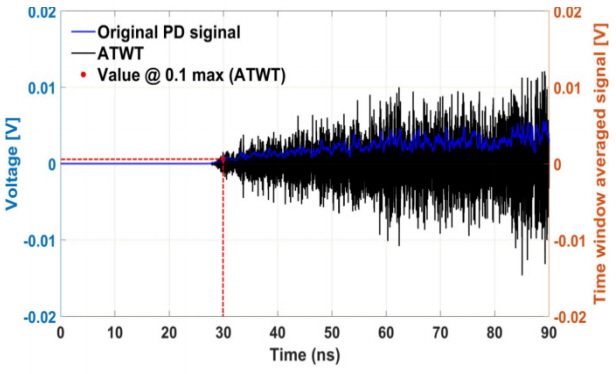
4. Average Time Window Threshold Method
The average time window threshold method is used to generate an average signal over a shifting window on the time axis. Note that this method more robust against noise than the first peak method because it eliminates some oscillations. This method is defined as [7, 8]:
where wt is the width of the time window. Eqs. (4) and (5) are used to determine the value of wt using the frequency spectrum of the UHF signal.
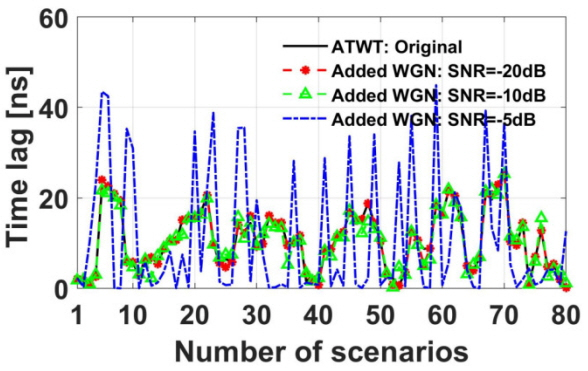
where, fa is the average frequency of the UHF signal calculated using its frequency spectrum V(f). In this work, the threshold value chosen is 10% of the time window averaged signal, as shown in Fig. 10. Fig. 11 shows an example of the average time window threshold between the signal captured by reference sensor 4 and that captured by sensor 1 for 80 scenarios. Table 5 shows the average error of arrival time difference for the average time window threshold method. We confirmed that the average time window threshold method is not robust to noise.
IV. Conclusion
We have studied estimating the arrival time of UHF signals for PD localization in a power transformer. Four methodsŌĆöthe first peak method, the cross-correlation method, the energy criterion method, and the average time window threshold methodŌĆöare used to estimate the accuracy of arrival time difference. We have investigated the influence of noise with three different intensities on the arrival time of UHF signals and have confirmed that the energy criterion method is the most robust to noise.