RF and Microwave Power Standards from 10 MHz to 40 GHz over Decades
Article information
Abstract
Radio frequency (RF) and microwave power is one of the key quantities in the framework of electromagnetic measurement standards. Therefore, the stability of the power standard is essential to users’ reliable measurements in various areas. Coaxial and waveguide thermistor mounts are used as transfer standards of RF and microwave power. Over decades, the effective efficiencies of thermistor mounts have been measured using coaxial and waveguide microcalorimeters in the frequency range of 10 MHz–40 GHz. The measurement uncertainty of the effective efficiency is evaluated. Results show that the power standards have been well maintained within the measurement uncertainty.
I. Introduction
Measurement standards for radio frequency (RF) and microwave measurements are based on key quantities, such as power, impedance, attenuation, RF voltage, noise, antenna characteristics, field strength, material parameters, and signal and pulse characteristics. Among these quantities, power is a fundamental one in the framework of electromagnetic measurement standards. In general, a microcalorimeter is used as the primary standard of RF and microwave power [1–4].
Under a technical cooperation program between Korea and Germany, several coaxial and waveguide microcalorimeters were developed by Physikalisch-Technische Bundesanstalt and transferred to the Korea Research Institute of Standards and Science in 1985–1991. Since then, the microcalorimeters have served as the primary standard of RF and microwave power in Korea [4, 5]. A transfer standard of RF and microwave power is the thermistor mount by which net delivered RF power is converted into DC substituted power. A characteristic parameter, the effective efficiency of the thermistor mount, is measured using the microcalorimeter. In this study, we present the effective efficiency of coaxial and waveguide thermistor mounts measured over decades in the frequency range of 10 MHz to 40 GHz. The measurement uncertainty of the effective efficiency is also discussed.
II. Microcalorimeters and Effective Efficiency
A microcalorimeter measures the temperature rise due to the heat generated by an RF power sensor, such as a thermistor mount or a thermocouple power sensor. The effective efficiency ηe of a power sensor is defined by [3]
where PDC,sub is the DC substituted power and PRF,net is the net delivered RF power [3]. If PRF,net is completely absorbed by the power sensing element installed in the power sensor, the effective efficiency will be 1, which is an ideal condition. However, a fraction of PRF,net is inherently dissipated in places other than the power sensing element, and the fraction should be taken into account. Moreover, the incident RF power PRF,inc is reflected by the power sensor. The calibration factor Kb is given by [6]
where Γl is the reflection coefficient of the power sensor.
For the sake of completeness, we briefly describe a twin-type microcalorimeter. Fig. 1 is a simple illustration of a twin coaxial or waveguide microcalorimeter with peripheral instruments. A microcalorimeter detects the temperature rise at its measurement plane caused by the heat generated by the dissipated RF power in the form of electromotive force. Thermal isolation sections are employed to confine the heat generated by the power sensing element to a section closest to the measurement plane in Fig. 1.
The microcalorimeter has two input transmission lines (Fig. 1). One input line can be used as an active side to which the thermistor mount under measurement is connected, and the other one serves as the reference side [2]. A Type IV power bridge supplies the DC bias current to the “active side” thermistor mount. The power bridge is an instrument for RF power measurement through the DC substitution of a thermistor mount [7]. The thermopile consisting of tens of thermocouple junctions produces a temperature-dependent voltage as a result of the thermoelectric effect.
The effective efficiency of a thermistor mount is given by [4],
where g is the overall correction factor, V1 and V2 are the bridge voltages when the RF power is off and on, respectively, and e1 and e2 are the output voltages of the thermopile corresponding to V1 and V2, respectively, at the thermal equilibrium state. The correction factor is given by [4]
where L is the correction factor for the loss of thermal isolation sections, A for the loss of the wall of the thermistor mount, and Q for the nonlinear thermopile output. These effects have to be quantitatively evaluated to assign the value of g at each measurement frequency. The results are presented in [3–5]. Consequently, we successfully establish the RF and microwave standards in 1989 up to 18 GHz using coaxial microcalorimeters and in 1997 up to 40 GHz using waveguide microcalorimeters. As these systems have been used for decades, we also develop a new Type-N microcalorimeter [8].
III. Measurements and Results
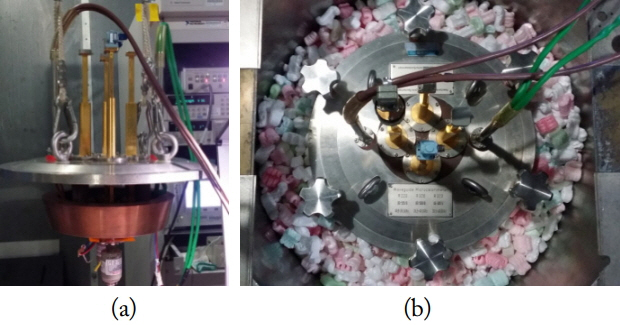
We measure the effective efficiency of thermistor mounts in a shielded room, where the temperature is maintained at 23.0°C ± 0.2°C. Fig. 2 is a pictorial view of the waveguide microcalorimeter. Fig. 2(a) shows the K- and Ka-band waveguide microcalorimeters. As illustrated in Fig. 2(b), the waveguide microcalorimeters are installed into a water bath. For the temperature stabilization of the microcalorimeter, we fill the bath with water until 2013. Water is replaced with styrofoam pieces so that the microcalorimeter has a longer lifetime (Fig. 2(b)). Note that changing from water to styrofoam pieces does not affect the correction factor g because the volume occupied by the materials in Fig. 1 affects only the temperature variation of the innermost space, not on the loss of the thermal isolation sections or thermopile nonlinear characteristics. We experimentally verify the effect by measuring 7-mm coaxial thermistor mounts. The difference in the measured effective efficiencies before and after the material change is within 0.002. The temporal response of the thermopile output voltage of a 7-mm coaxial thermistor mount is measured over 105 minutes, as shown in Fig. 3. From the data, we obtain the thermopile output voltages e1 and e2, which correspond to V1 and V2, at each thermal equilibrium state.

A pictorial view of a microcalorimeter. (a) K- and Ka-band waveguide microcalorimeter. (b) The bath filled with styrofoam pieces instead of water.

An example of the temporal response of the thermopile output voltage of a 7-mm coaxial thermistor mount over 105 minutes.
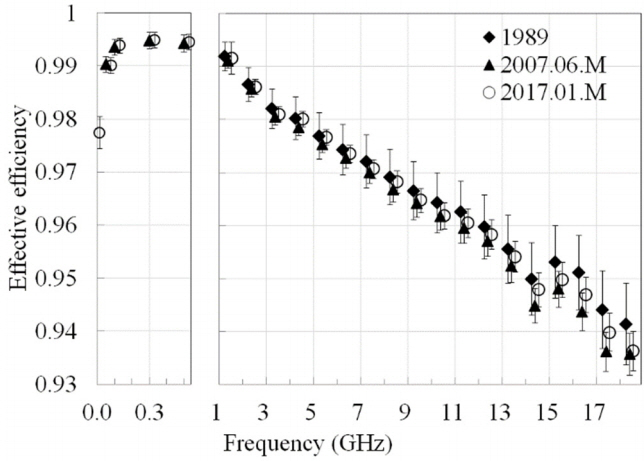
Fig. 4 shows the measured effective efficiency of a 7-mm coaxial thermistor mount. The vertical bar indicates the expanded uncertainty for the data in 2007 and 2017 and the total uncertainty in 1989. The expanded uncertainty (k = 2, a level of confidence of approximately 95%) has been evaluated by the Guide to the Expression of Uncertainty in Measurement (GUM) [9], and the expanded uncertainty values are within 0.005. Details on the uncertainty evaluation are found in [3–5]. The total uncertainty in 1989 includes systematic uncertainty and random uncertainty. We added up each uncertainty component without considering the probability distribution [4, 5], and we refer to it as the add-up method. The total uncertainty for the 7-mm coaxial thermistor mount is within 0.008. This explanation is applied to the results for the K- and Ka-band waveguide thermistor mounts to be shown later. Note that measurement uncertainty generally means the expanded uncertainty (k = 2) unless otherwise stated. As observed in Fig. 1, measured data are in good agreement within the expanded uncertainty for over nearly three decades except above 16 GHz. Table 1 summarizes the uncertainty budget by the GUM at 1, 8, and, 18 GHz.

Effective efficiency of a 7-mm coaxial thermistor mount measured at the port M of the coaxial microcalorimeter (HP 8478B, Serial number (S/N) 2106A15783).
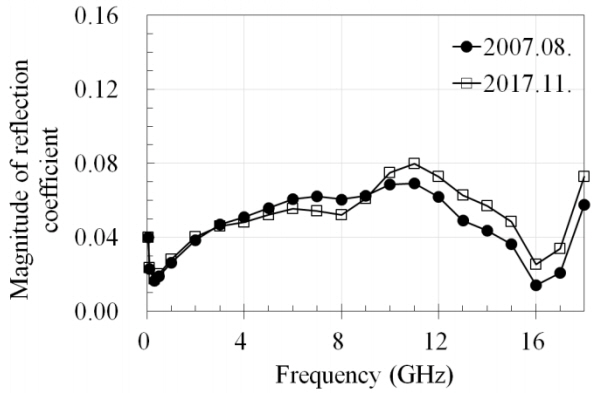
As well known, the reflection coefficient of a thermistor mount does not have a direct effect on the effective efficiency, as given by (3). However, observing the long-term variation of the reflection coefficient of a thermistor mount is meaningful because users usually need the calibration factor containing the reflection coefficient as in (2). For example, Fig. 5 shows the reflection coefficient of the same 7-mm coaxial thermistor mount in Fig. 4, and the values vary up to 0.015.
Figs. 6 and 7 illustrate the effective efficiency of the K- and Ka-band waveguide thermistor mounts. For comparison, the expanded uncertainty evaluated by the GUM in 2017 and the total uncertainty obtained by the add-up method in 2010 or 2011 are illustrated by vertical bars at each frequency. Again, the measured results are in good agreement within the expanded uncertainty for the K- and Ka-band waveguide thermistor mounts. Tables 2 and 3 present the uncertainty budgets for the K- and Ka-band waveguide thermistor mounts (k = 2), respectively. In summary, the RF and microwave power standards are well maintained within the measurement uncertainty over decades. The expanded uncertainty discussed in this study is reasonably relaxed to increase reliability, and the resultant uncertainty is posted as the calibration and measurement capabilities on the International Bureau of Weights and Measures webpage [10]. The RF and microwave power standards discussed in this study are disseminated to domestic and foreign users by the direct comparison technique [11]. These standards ultimately help users to measure the related quantities with reliability.

Effective efficiency of a K-band waveguide thermistor mount measured at port P1 of the K-band waveguide microcalorimeter (HP K478A, S/N 06380).

Effective efficiency of a Ka-band waveguide thermistor mount measured at port P4 of the Ka-band waveguide microcalorimeter (HP R478A, S/N 06948).
IV. Conclusion
We measure the effective efficiency of coaxial and waveguide thermistor mounts using microcalorimeters in the frequency range of 10 MHz to 40 GHz over decades. The expanded uncertainty (k = 2) of the effective efficiency is evaluated to be 0.005 for a 7-mm coaxial thermistor mount and 0.003 for K-and Ka-band waveguide thermistor mounts. The results show a good agreement within the measurement uncertainty. For the 7-mm coaxial thermistor mount, the deviation over decades is slightly larger than the expanded uncertainty above 16 GHz. The results indicate that the national power standards have been well maintained. The RF and microwave power standards are disseminated to users by an appropriate technique. These standards function as an infrastructure of reliable RF and microwave power measurements for users.
Acknowledgments
This research was supported by Enhancement of Measurement and Standards Technologies in Physical SI units funded by the Korea Research Institute of Standards and Science (No. KRISS-2018-GP2018-0001).
References
Biography
Tae-Weon Kang received his B.S. degree in electronic engineering from Kyungpook National University, Daegu, Korea, in 1988 and his M.S. and Ph.D. degrees in electronic and electrical engineering from Pohang University of Science and Technology, Pohang, Korea, in 1990 and 2001, respectively. Since 1990, he has been with the Center for Electromagnetic Metrology, Division of Physical Metrology, Korea Research Institute of Standards and Science, Daejeon, Korea, working on electromagnetic metrology as a principal research scientist. In 2002, he spent a year as a visiting researcher under the Korea Science and Engineering Foundation postdoctoral fellowship program at the George Green Institute for Electromagnetics Research, University of Nottingham, and he worked on the measurement of the absorbing performance of electromagnetic absorbers and on the generalized transmission line modeling method. His research interests include electromagnetic metrology, such as electromagnetic power, noise, and antenna characteristics, and numerical modeling in electromagnetic compatibility. He was a professor in medical physics at the University of Science and Technology, Daejeon, from 2006 to 2015, and he has been a professor in the science of measurement since 2016.

Jeong-Il Park received his B.S. and M.S. degrees from Chungnam National University, Daejeon, Korea, in 1988 and 1990, respectively. In 1993, he joined the Center for Electromagnetic Metrology, Division of Physical Metrology, Korea Research Institute of Standards and Science, Daejeon, Korea, where he is currently engaged in the measurement of antenna characteristics and electromagnetic measurement standards.

Jae-Yong Kwon received his B.S. degree in electronics from Kyungpook National University, Daegu, Korea, in 1995, and his M.S. and Ph.D. degrees in electrical engineering from the Korea Advanced Institute of Science and Technology, Daejeon, Korea, in 1998 and 2002, respectively. In 2001, he was a visiting scientist at the Department of High-Frequency and Semiconductor System Technologies, Technical University of Berlin, Berlin, Germany. From 2002 to 2005, he was a senior research engineer at the Devices and Materials Laboratory, LG Electronics Institute of Technology, Seoul, South Korea. Since 2005, he has been a principal research scientist at the Center for Electromagnetic Metrology, Division of Physical Metrology, Korea Research Institute of Standards and Science, Daejeon, Korea. Since 2013, he has been a professor in the science of measurement at the University of Science and Technology, Daejeon. His current research interests include electromagnetic power, impedance, and antenna measurement. Dr. Kwon is an IEEE senior member.

No-Weon Kang received his B.S., M.S., and Ph.D. degrees in electrical engineering from Seoul National University, Seoul, Korea, in 1991, 1994, and 2004, respectively. His doctoral work in numerical analysis centered on the FDTD method, particularly the algorithm that reconstructs the complex permittivity profile of unknown scatterers. From 1994 to 1999, he was with the Electromagnetic Apparatus Laboratory, LG Industrial Systems, where he worked in the field of static magnetic field analysis of electrical apparatus. Since 2004, he has been with the Korea Research Institute of Standards and Science, Daejeon, Korea, where he is currently the head of the Center for Electromagnetic Metrology, Division of Physical Metrology, and a principal research scientist working on electromagnetic metrology. His research interests include electromagnetic field strength, antenna measurement standards, EMI/EMC issues, and electrooptic sensor systems.


