


I. INTRODUCTION
In recent decades, technological developments have helped extend the life expectancy of humans, leading to an increase in the population of older adults [1]. For elderly individuals, falling represents a serious problem that leads to minor injuries [2, 3], such as bruises, ligament sprains, and fractures, or, in severe cases, death. In addition to physical injuries, falling may also induce a fear of falling [4, 5], leading to the further evasion of physical activity and even depression [5]. Therefore, to prevent such situations, it is crucial to predict and prevent fall accidents in advance [6].
Notably, patients in hospitals or nursing homes suffering from Parkinson’s disease or dementia who move on their own without the assistance of their caregivers are prone to falling [7, 8]. Such patients face difficulty in maintaining their balance and walking due to weakened muscles [9]. Furthermore, falling is a common occurrence when changing postures. For instance, sitting up on bed from a lying-down position has been identified as a primary cause of falling [10, 11]. In particular, sitting on the bed alone to subsequently stand up is risky for patients with severe mobility issues. Therefore, sitting up and sitting on the edge of the bed can be considered falling risk behaviors for these patients.
Various sensors, such as smart bed railings, pressure sensors, wearable devices, and camera sensors, have been used to categorize daily activities so as to detect and prevent falling [6, 12–14]. However, these devices require contact and restrict activity, causing discomfort and a sense of hostility. Moreover, the use of camera sensors raises concerns regarding the infringement of privacy rights. Radars, a non-contact, non-restrictive sensor, have been used to solve the problem of activity restriction and infringement of privacy rights.
Radars are non-contact, non-restrictive sensors that are small in size and have minimal impact on their surrounding environment. Radar-based research is being conducted in various fields, such as motion recognition for indoor activity monitoring, hand motion recognition, walking pattern analysis, and biological signal monitoring, such as tracking breathing and heartbeats [15–18]. However, relevant research on risk detection has been limited, with studies conducted on falling focusing primarily on detection rather than prevention. In addition, previous fall detection studies have largely depended on range and velocity information [19–23]. However, risk behaviors are difficult to distinguish using only speed and velocity information without accounting for the distinct characteristics of patients’ daily activities.
This study aimed to develop novel characteristic features based on frequency-modulated continuous-wave (FMCW) radar—a non-contact, non-restrictive sensor—to detect risk situations. Machine learning was employed to distinguish and detect risk behavior from daily activities. Furthermore, the performance observed in cases considering the conventional and new characteristic features were compared to draw further insights.
II. FMCW RADAR SIGNAL
The FMCW radar transmits continuous waves modulated by frequency. Notably, a continuous wave signal whose frequency increases linearly over time is called a chirp. In such a context, range-Doppler decoupling can be implemented if the chirp rate is fast enough compared to the maximum measurement velocity. Therefore, a fast chirp FMCW radar characterized by 64 multiple chirps in one scan was utilized in this study. Fundamentally, radars transmit electromagnetic waves and receive the waves reflected from objects. The transmission and reception signals are combined by passing them through a mixer, and the frequency of the two signals is divided into sum and difference. Subsequently, only the beat frequency or the frequency difference remain after low-pass filtering, while the analog signal is converted into a digital signal. The demodulated signal x(n,m,t) can be expressed as Eq. (1):
where A(n,m,t) indicates the demodulated signal amplitude at the n-th sample, the m-th chirp, and the t-th scan. The frequency of the beat frequency signal fr can be calculated as
f r = B W · 2 · r T c · c f v = 2 · F c · T c · v c
The frequency of the beat frequency signal fr contains the range information, while the phase change at a specific range fv provides the velocity information. As a result, a frequency analysis must be conducted to obtain the range and velocity information from the beat frequency signal. Frequency analysis entails conducting a range-fast Fourier transform (FFT) to obtain the range information, followed by a Doppler-FFT to acquire the velocity information. Eqs. (2) and (3) represent the signal conducting range-FFT and signal performing Doppler-FFT, respectively.
Subsequently, the range map RM(r,t), the Doppler map DM(v,t), and the range velocity map RVM(r,t) containing the range and velocity information along with time can be defined, as in Eqs. (4), (5), and (6) [24].
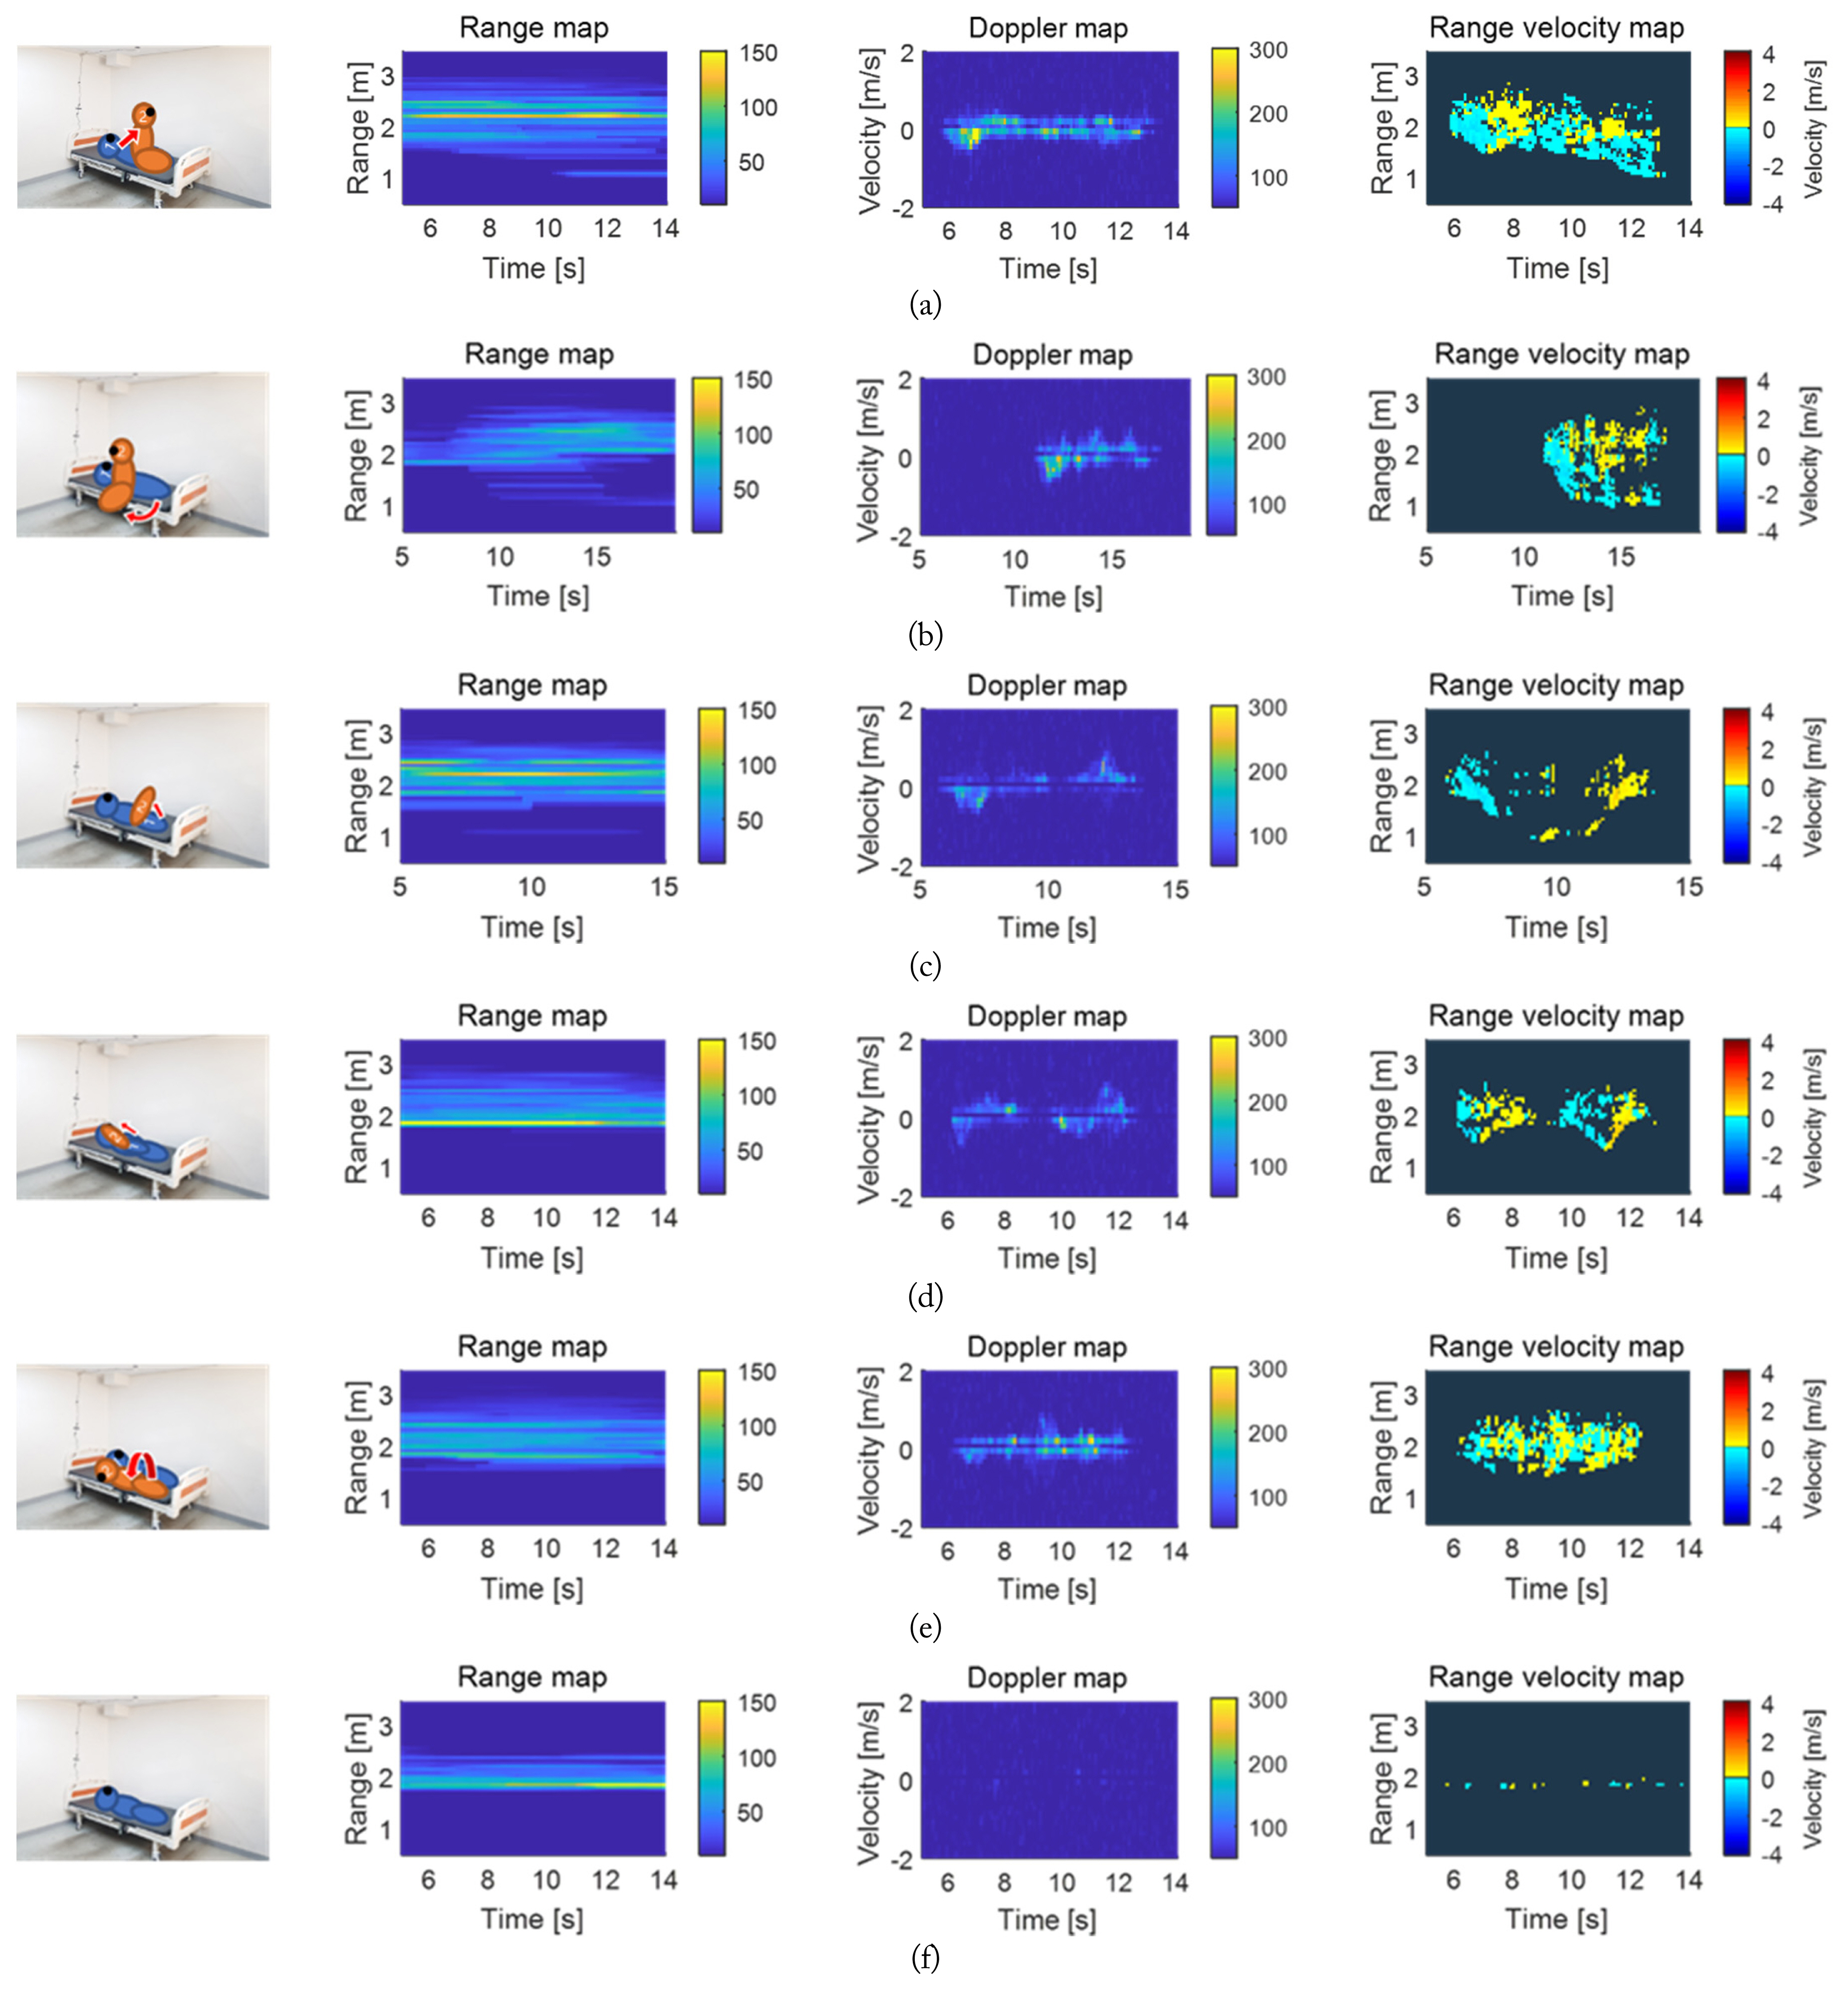
The range map depicts range information in terms of time, with the corresponding value referring to the power, which appears substantial if there is an object within the corresponding range and less so if not. The Doppler map presents the velocity information in terms of time, with the corresponding value indicating power, similar to the range map. The range velocity map shows the value for velocity along with the highest power by range as a representative value while also offering information on the range in terms of time. Notably, the range velocity map can be used to simultaneously obtain information on the range and velocity. Fig. 1 presents comparisons of the three maps for each behavior, confirming that the map appears different for each behavior. This indicates the need for adding quantified characteristic features to ascertain the differences between each behavior.
III. PROPOSED CHARACTERISTIC FEATURES
Table 1 lists the seven characteristic features considered in this study to detect the risk of falling. Four of these features, which have already been used in radar-based motion recognition research, are related to range and velocity [16, 25], while the remaining three are novel characteristic features included to represent movement.
1. Conventional Characteristic Features
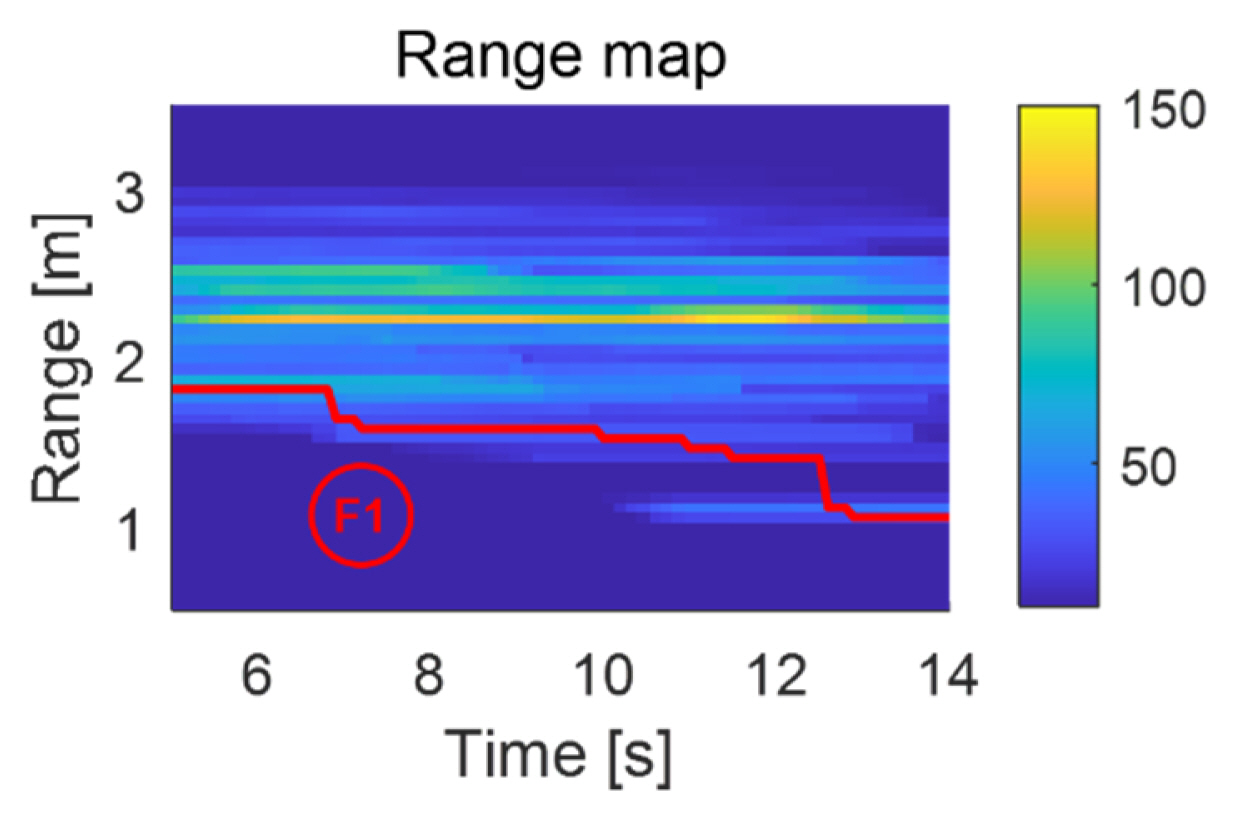
Nearest range rn(t) refers to the minimum range that exhibits a power indicating the presence of an object on the range map. The radar is “approached” as the upper body rises from the lying-down position when sitting up. In such a situation, the nearest range picks out the characteristics of such behavior. The equations related to the nearest range are noted in Eqs. (7) and (8), while Fig. 2 depicts its extraction. Notably, rth denotes the power threshold in the range map.
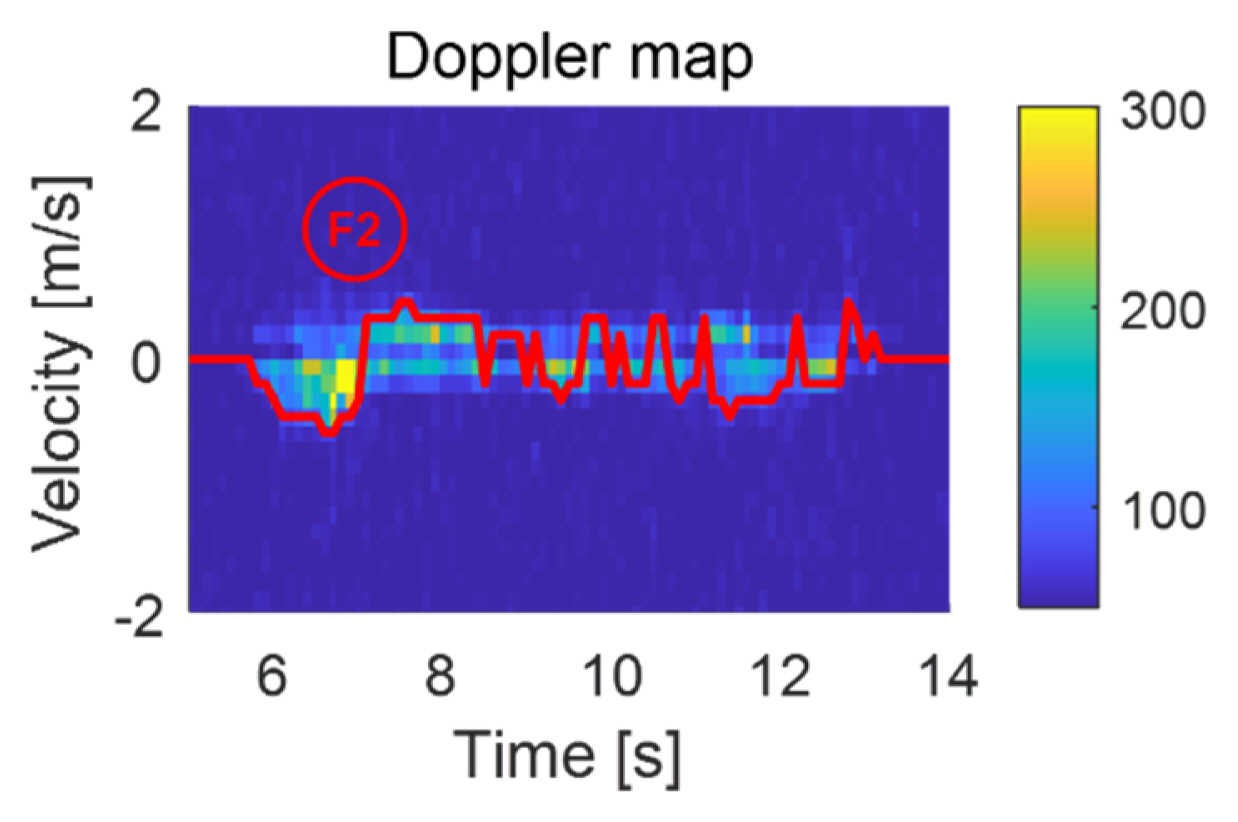
Peak velocity vpeak(t) refers to the velocity with the maximum absolute value, which exhibits power indicating the presence of an object on the Doppler map. This characteristic feature is used to identify the change in velocity that occurs when the upper body rises while sitting up. The equations pertaining to the peak velocity are noted in Eqs. (9) and (10), while Fig. 3 details the extraction of this characteristic feature. vth represents the power threshold in the Doppler map.
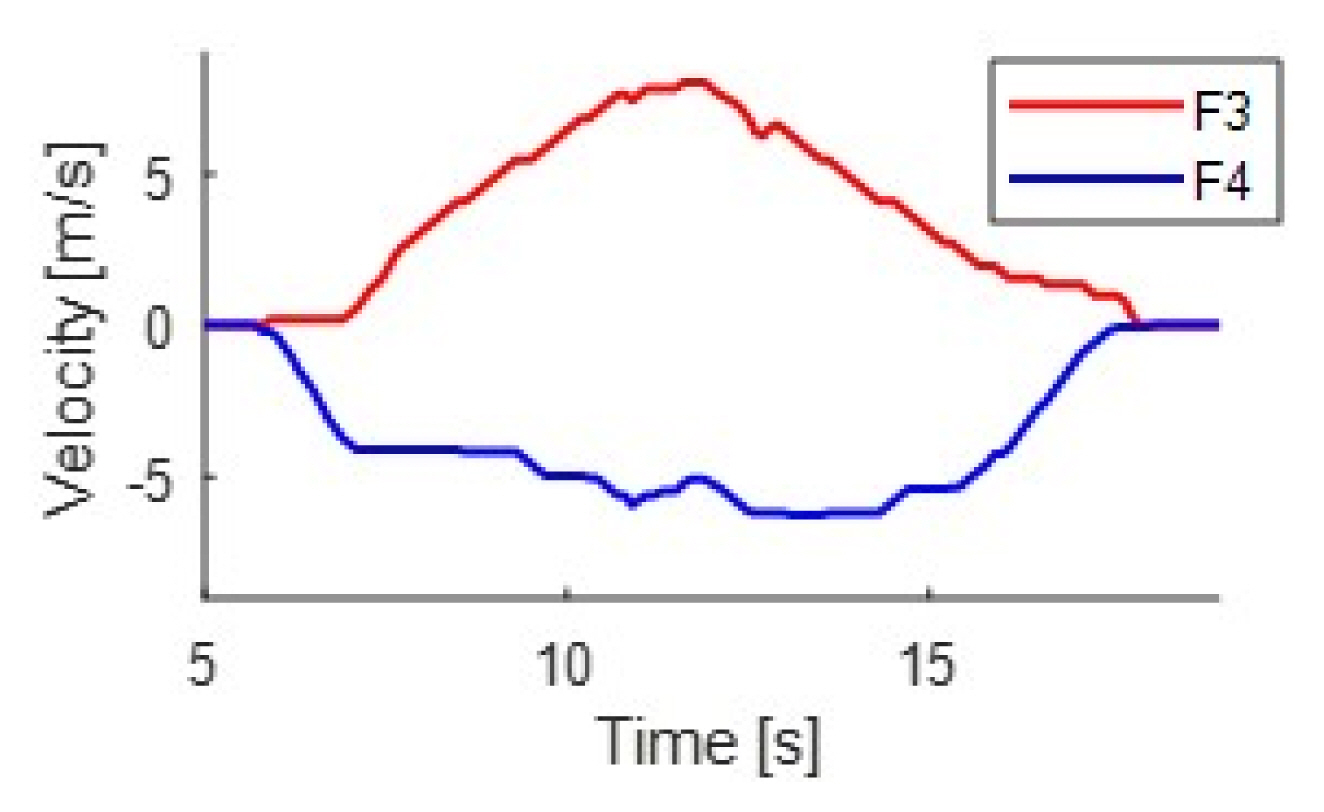
Accumulated positive velocity vap(t) refers to the value obtained by superimposing the positive velocities—velocities moving away from the radar—among the maximum absolute velocities in the range-velocity map for 5 seconds. Since the average duration of a behavior is 8 seconds, the window size is set to 5 seconds to observe the speed change. The positive and negative velocities coexist depending on whether the various body parts approach or move away from the radar during movement. Notably, this characteristic feature quantified only the positive velocity. The equations for calculating the accumulated positive velocity are noted in Eqs. (11), (12), and (13).
Accumulated negative velocity van(t) refers to the value obtained by superimposing the negative velocities—velocities approaching the radar—among the maximum absolute velocities in the range-velocity map for 5 seconds. This characteristic feature only quantifies the negative velocity. The equations for calculating the accumulated negative velocity are noted in Eqs. (14) and (15), while Fig. 4 depicts the accumulated positive and negative velocities.
The limitations encountered by conventional characteristic features with regard to range include it being measured as close when the legs, which occupy a hefty volume, are lifted instead of the upper body, leading to difficulties in detecting risk behavior. As a result, the three characteristic features related to velocity are unable to accurately distinguish risk behavior using only the velocity if the patient is slow.
2. New Characteristic Features
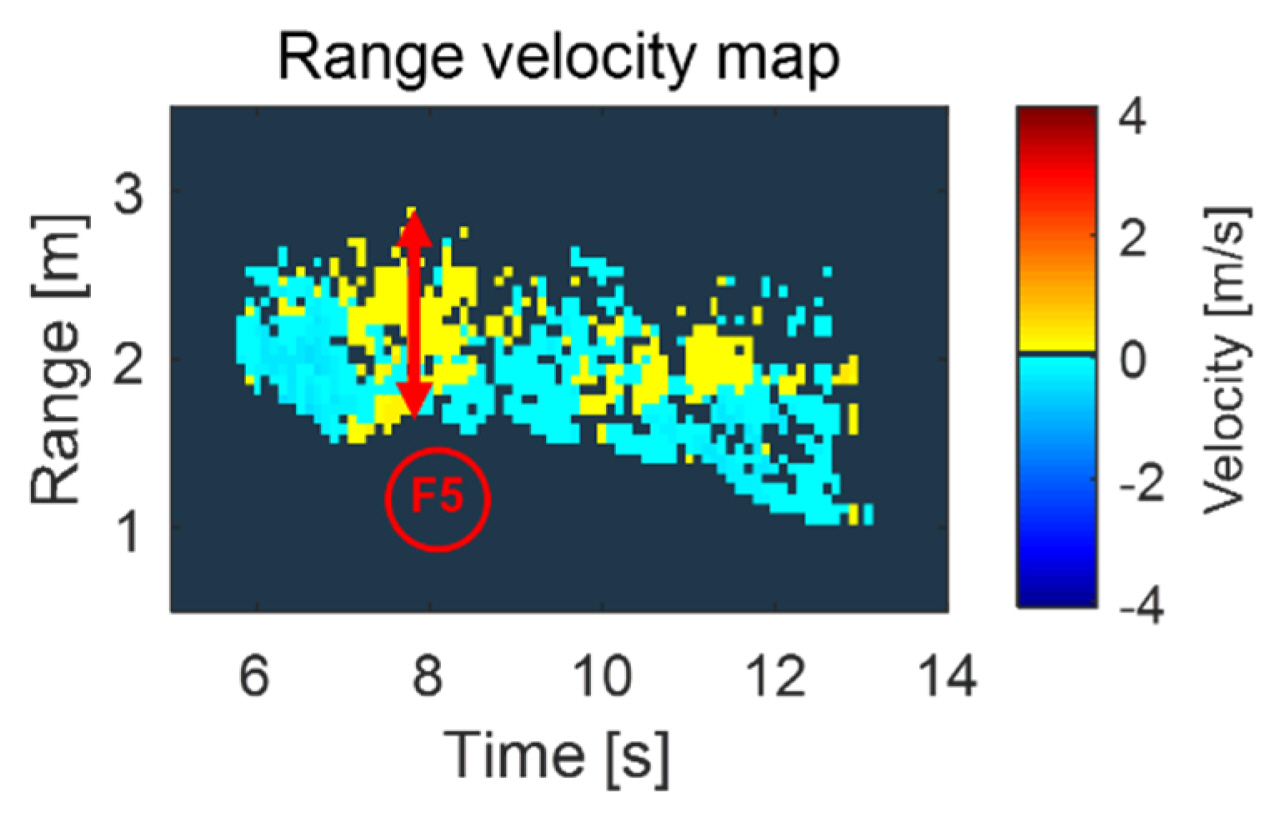
Range width rwidth refers to the width of the range within which movement occurs on the range velocity map. This characteristic feature performs quantifications to express the changes that occur in a moving body part over time. The equation for the range width is noted in Eq. (16), with Fig. 5 showing the extraction of this characteristic feature.
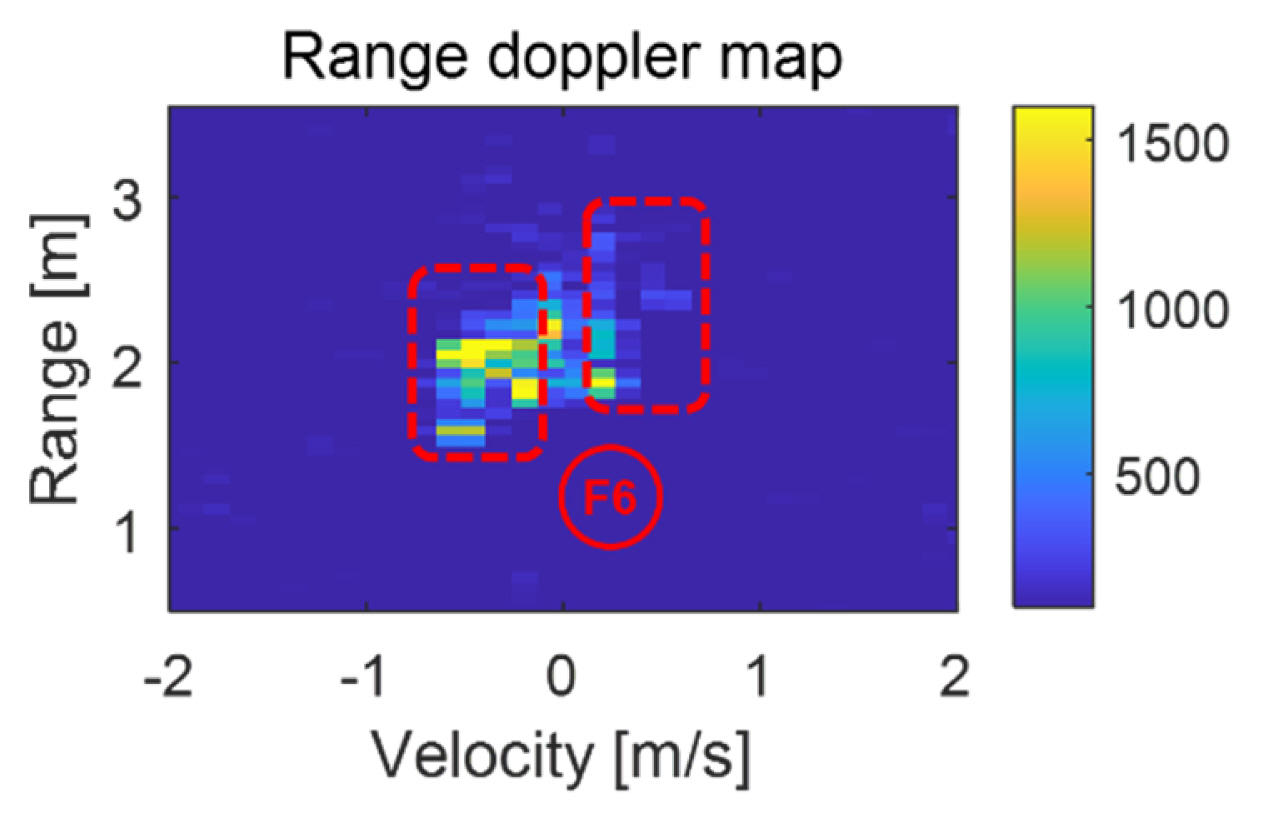
Activity area actm (t) refers to the width of the section with velocity, indicating motion. Movement changes occur over time, and this characteristic feature quantifies the areas exhibiting movement. The equations for the activity area are noted in Eqs. (17) and (18), while Fig. 6 presents the area extraction. Notably, actth is the power threshold at Z(r,v,t).
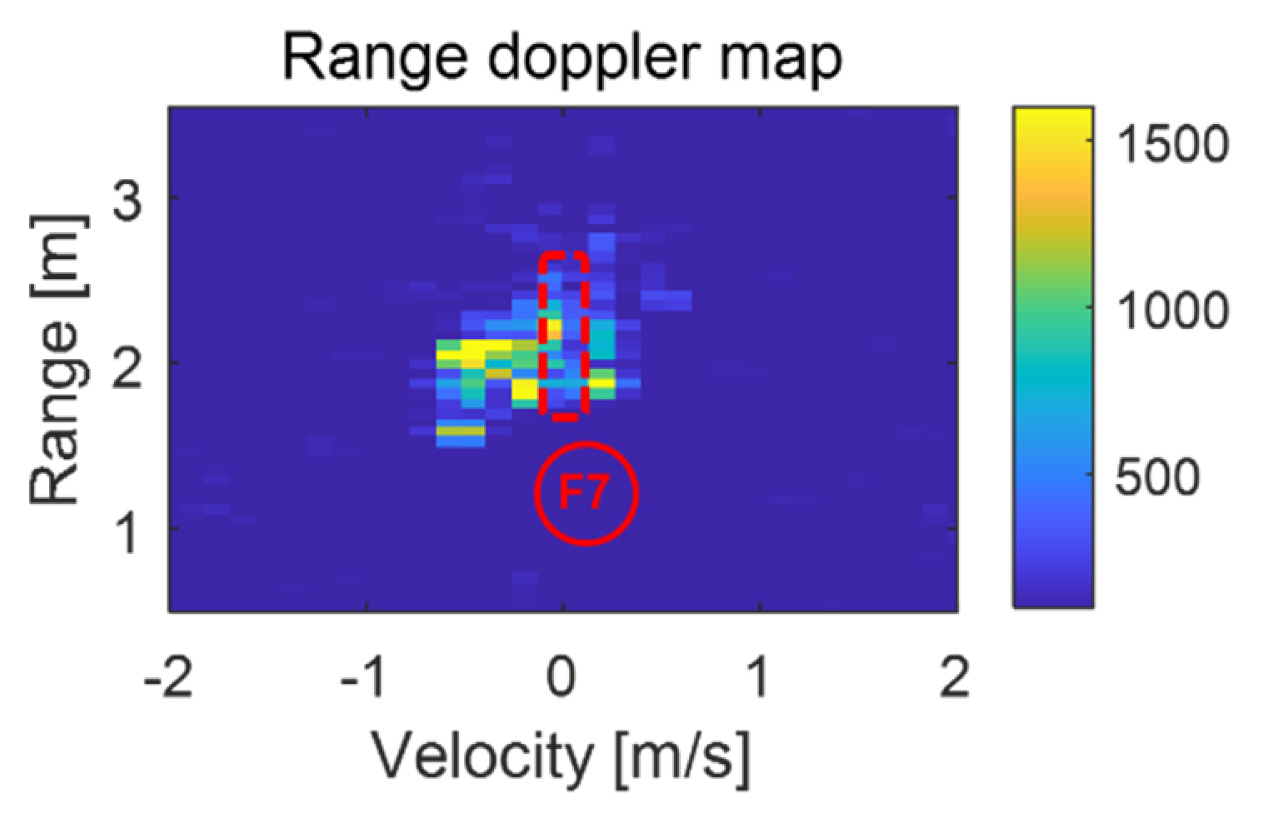
Non-activity area acts(t) refers to the width of the area that exhibits no velocity. In other words, this characteristic feature quantifies the areas that show no movement. The equation for the non-activity area is noted in Eq. (19), while Fig. 7 shows its extraction.
In this context, it should be noted that, even if the new characteristic features perform the same behavior, the value is measured differently. Therefore, distinguishing between risk behaviors and daily activities by considering only the characteristic feature values remains a challenge.
IV. EXPERIMENTAL RESULTS
1. Data Collection
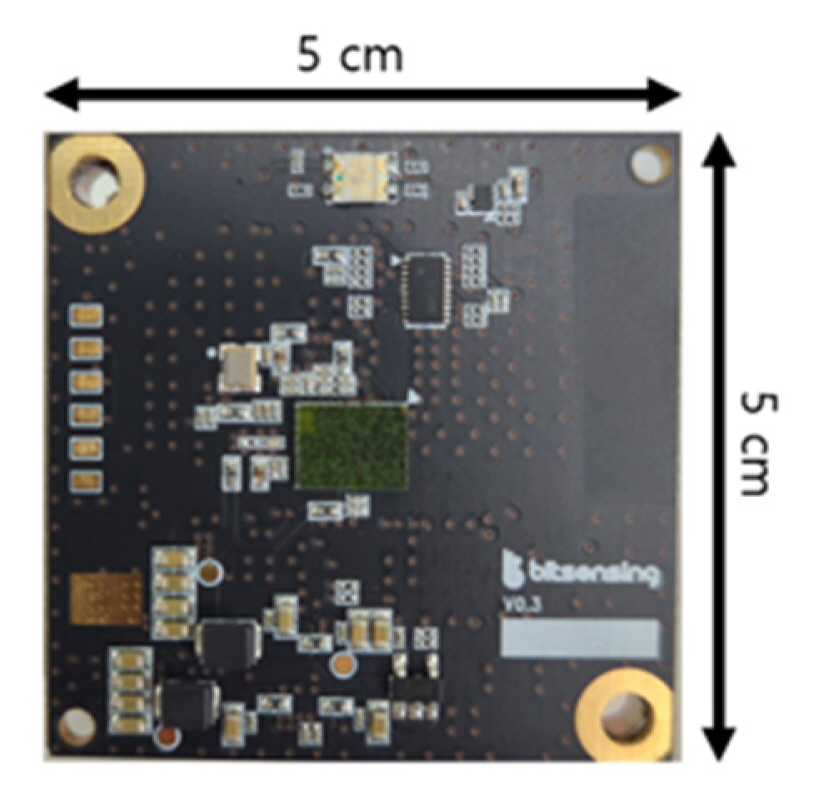
The current study used the mini-H (bitsensing, Seongnam, Korea)—an FMCW radar that operates at a center frequency of 61 GHz, a bandwidth of 3 GHz, and a chirp duration time of 300 μs. Fig. 8 shows a photograph of the FMCW radar exterior, while Table 2 lists the radar specifications. Furthermore, Fig. 9 shows the experimental environment. The radar was installed on the ceiling above the bed at a center position so that it was directed at the bed. The distance between the bed and the radar was approximately 1.8 m.
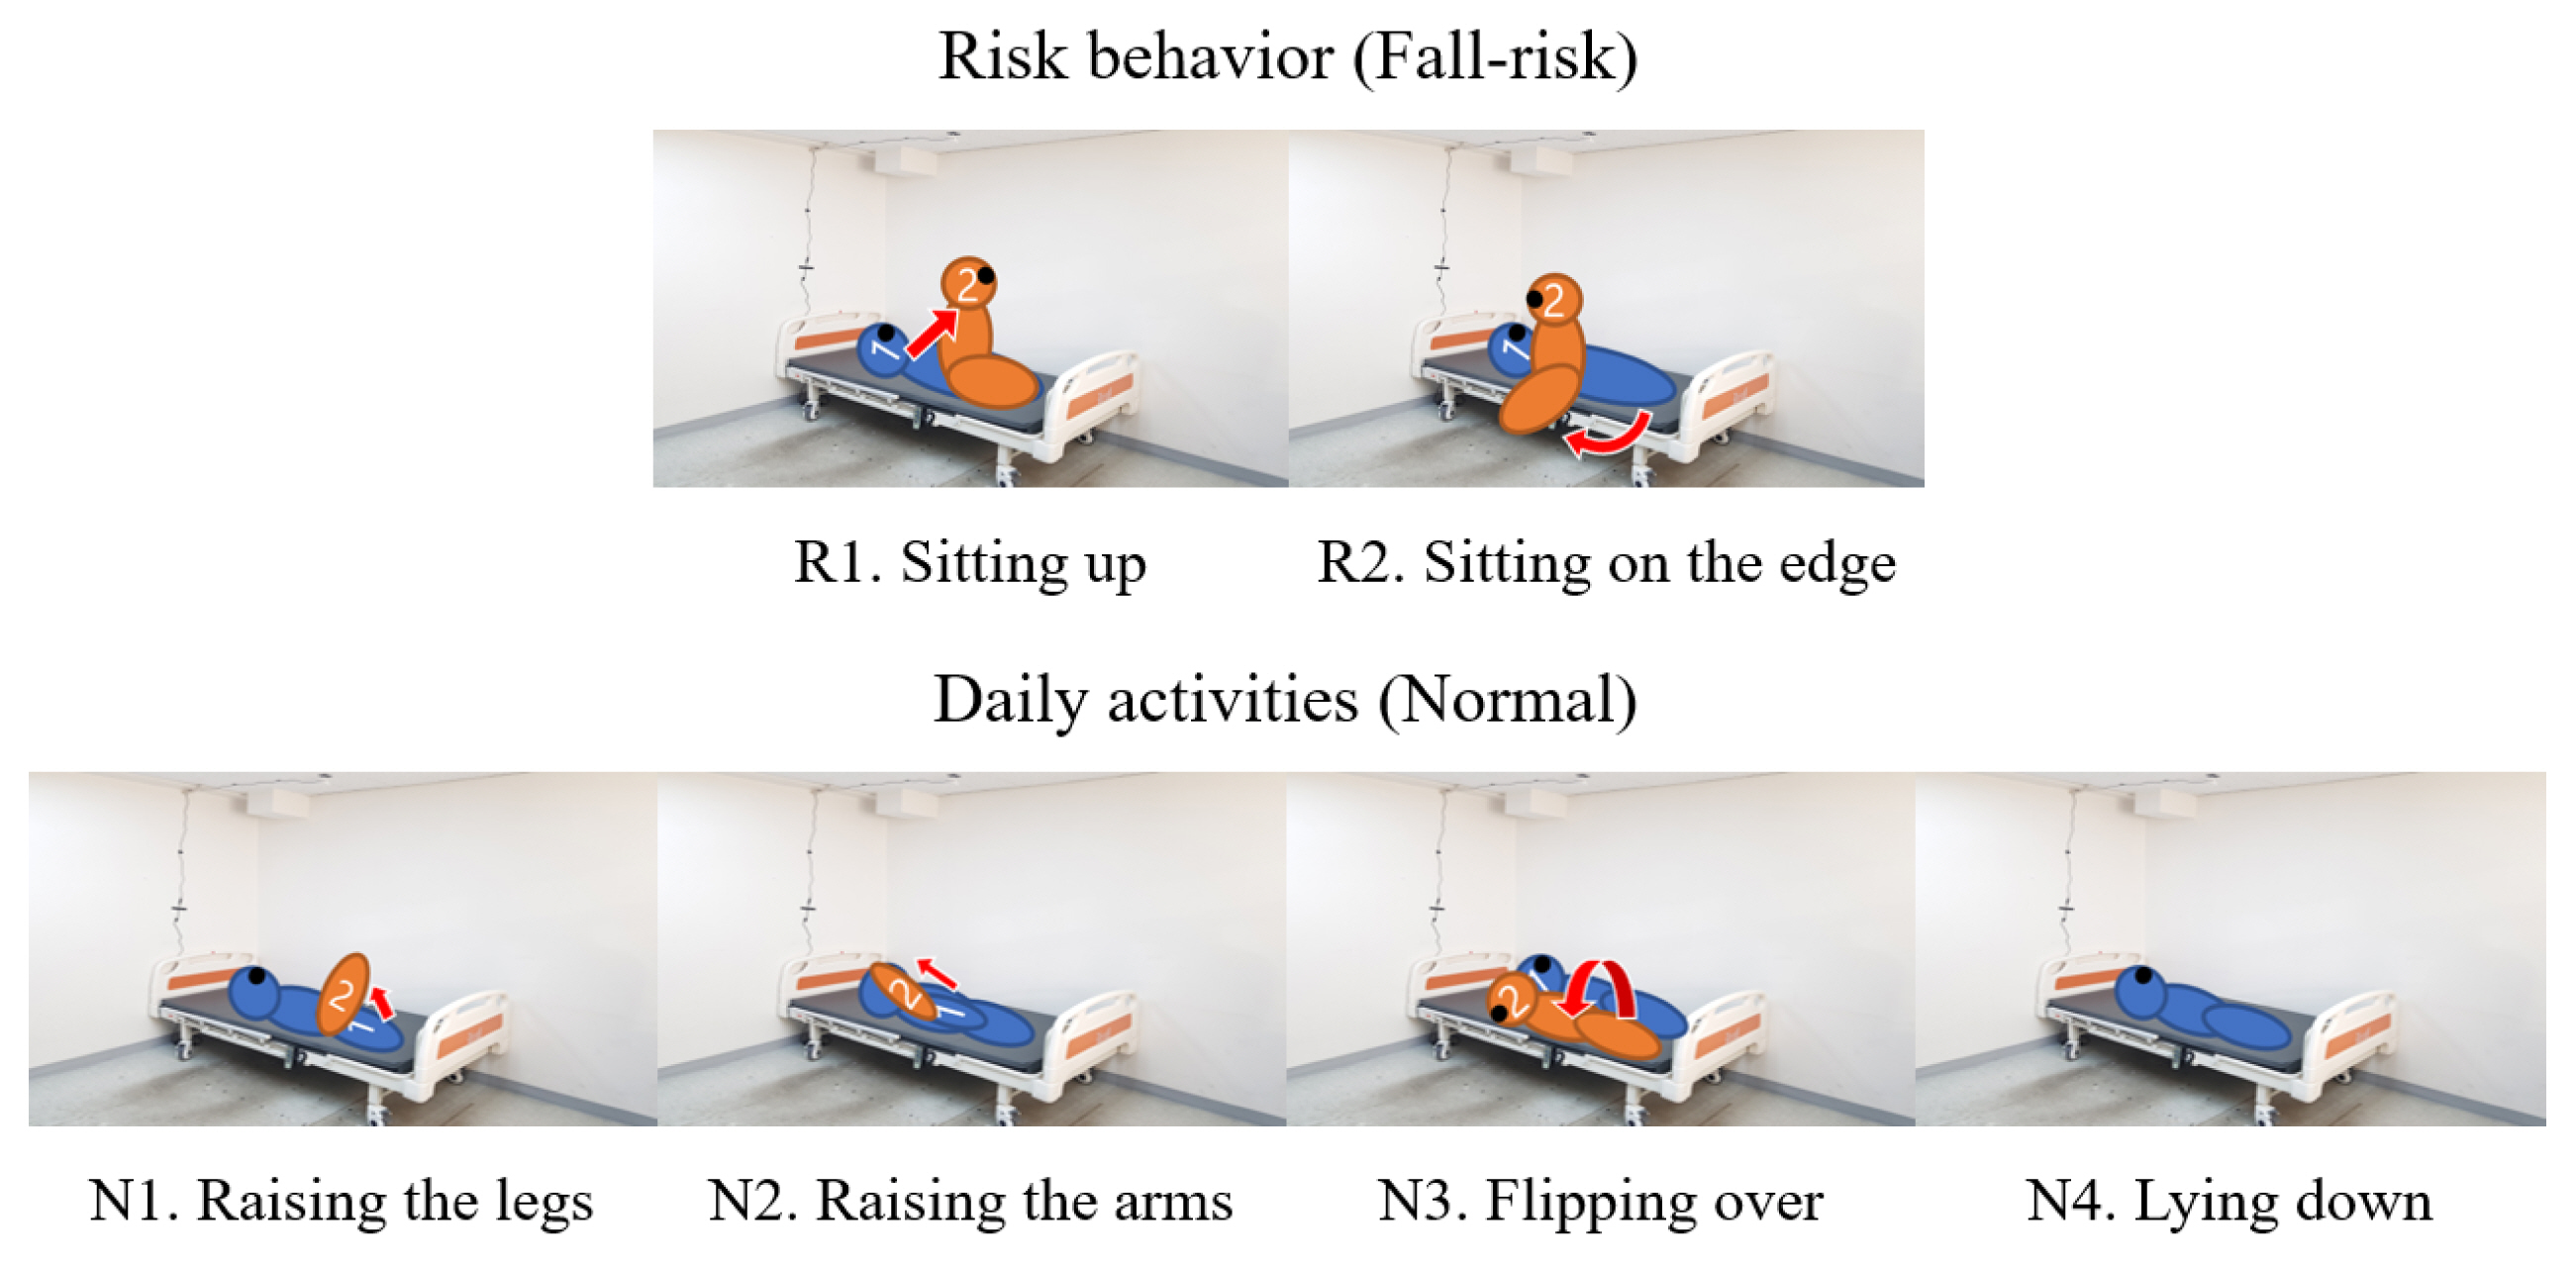
The data were collected from two participants aged 25–26, whose behaviors were tested very slowly, considering that the target group was patients with severe mobility issues. The experiment was conducted by setting the lying-in-bed position as the initial state and then moving on to performing various behaviors. The same threshold was applied to all subjects since the data were acquired at the same place. The behaviors conducted, including two risk behaviors and four daily activities, are listed in Fig. 10. The risk behaviors included sitting up (R1) and sitting on the edge of the bed (R2), while the daily activities included raising the legs (N1), raising the arms (N2), flipping over (N3), and lying down (N4). The total duration of each individual behavior was 20 seconds.
Table 3 lists the two methods used to collect data—individual and continuous behavior experiments. The individual behavior experiment independently measured a single behavior. The resulting data were used for model learning. This experiment acquired 118 pieces of data, including 59 risk behaviors and 59 daily activities. The continuous behavior experiment sequentially measured five consecutive behaviors, including the switching of behaviors and the order of the three sequences (SeqA, SeqB, SeqC). Although the data acquired from the continuous behavior experiments were not used for model learning, they were employed to test the classification results over time.
Notably, the continuous behavior experiment included a rest period of 10 seconds between the five different motions, with the total duration being 90 seconds. The total continuous behavior data were obtained by conducting the measurements twice for each procedure.
2. Characteristic Feature Comparisons
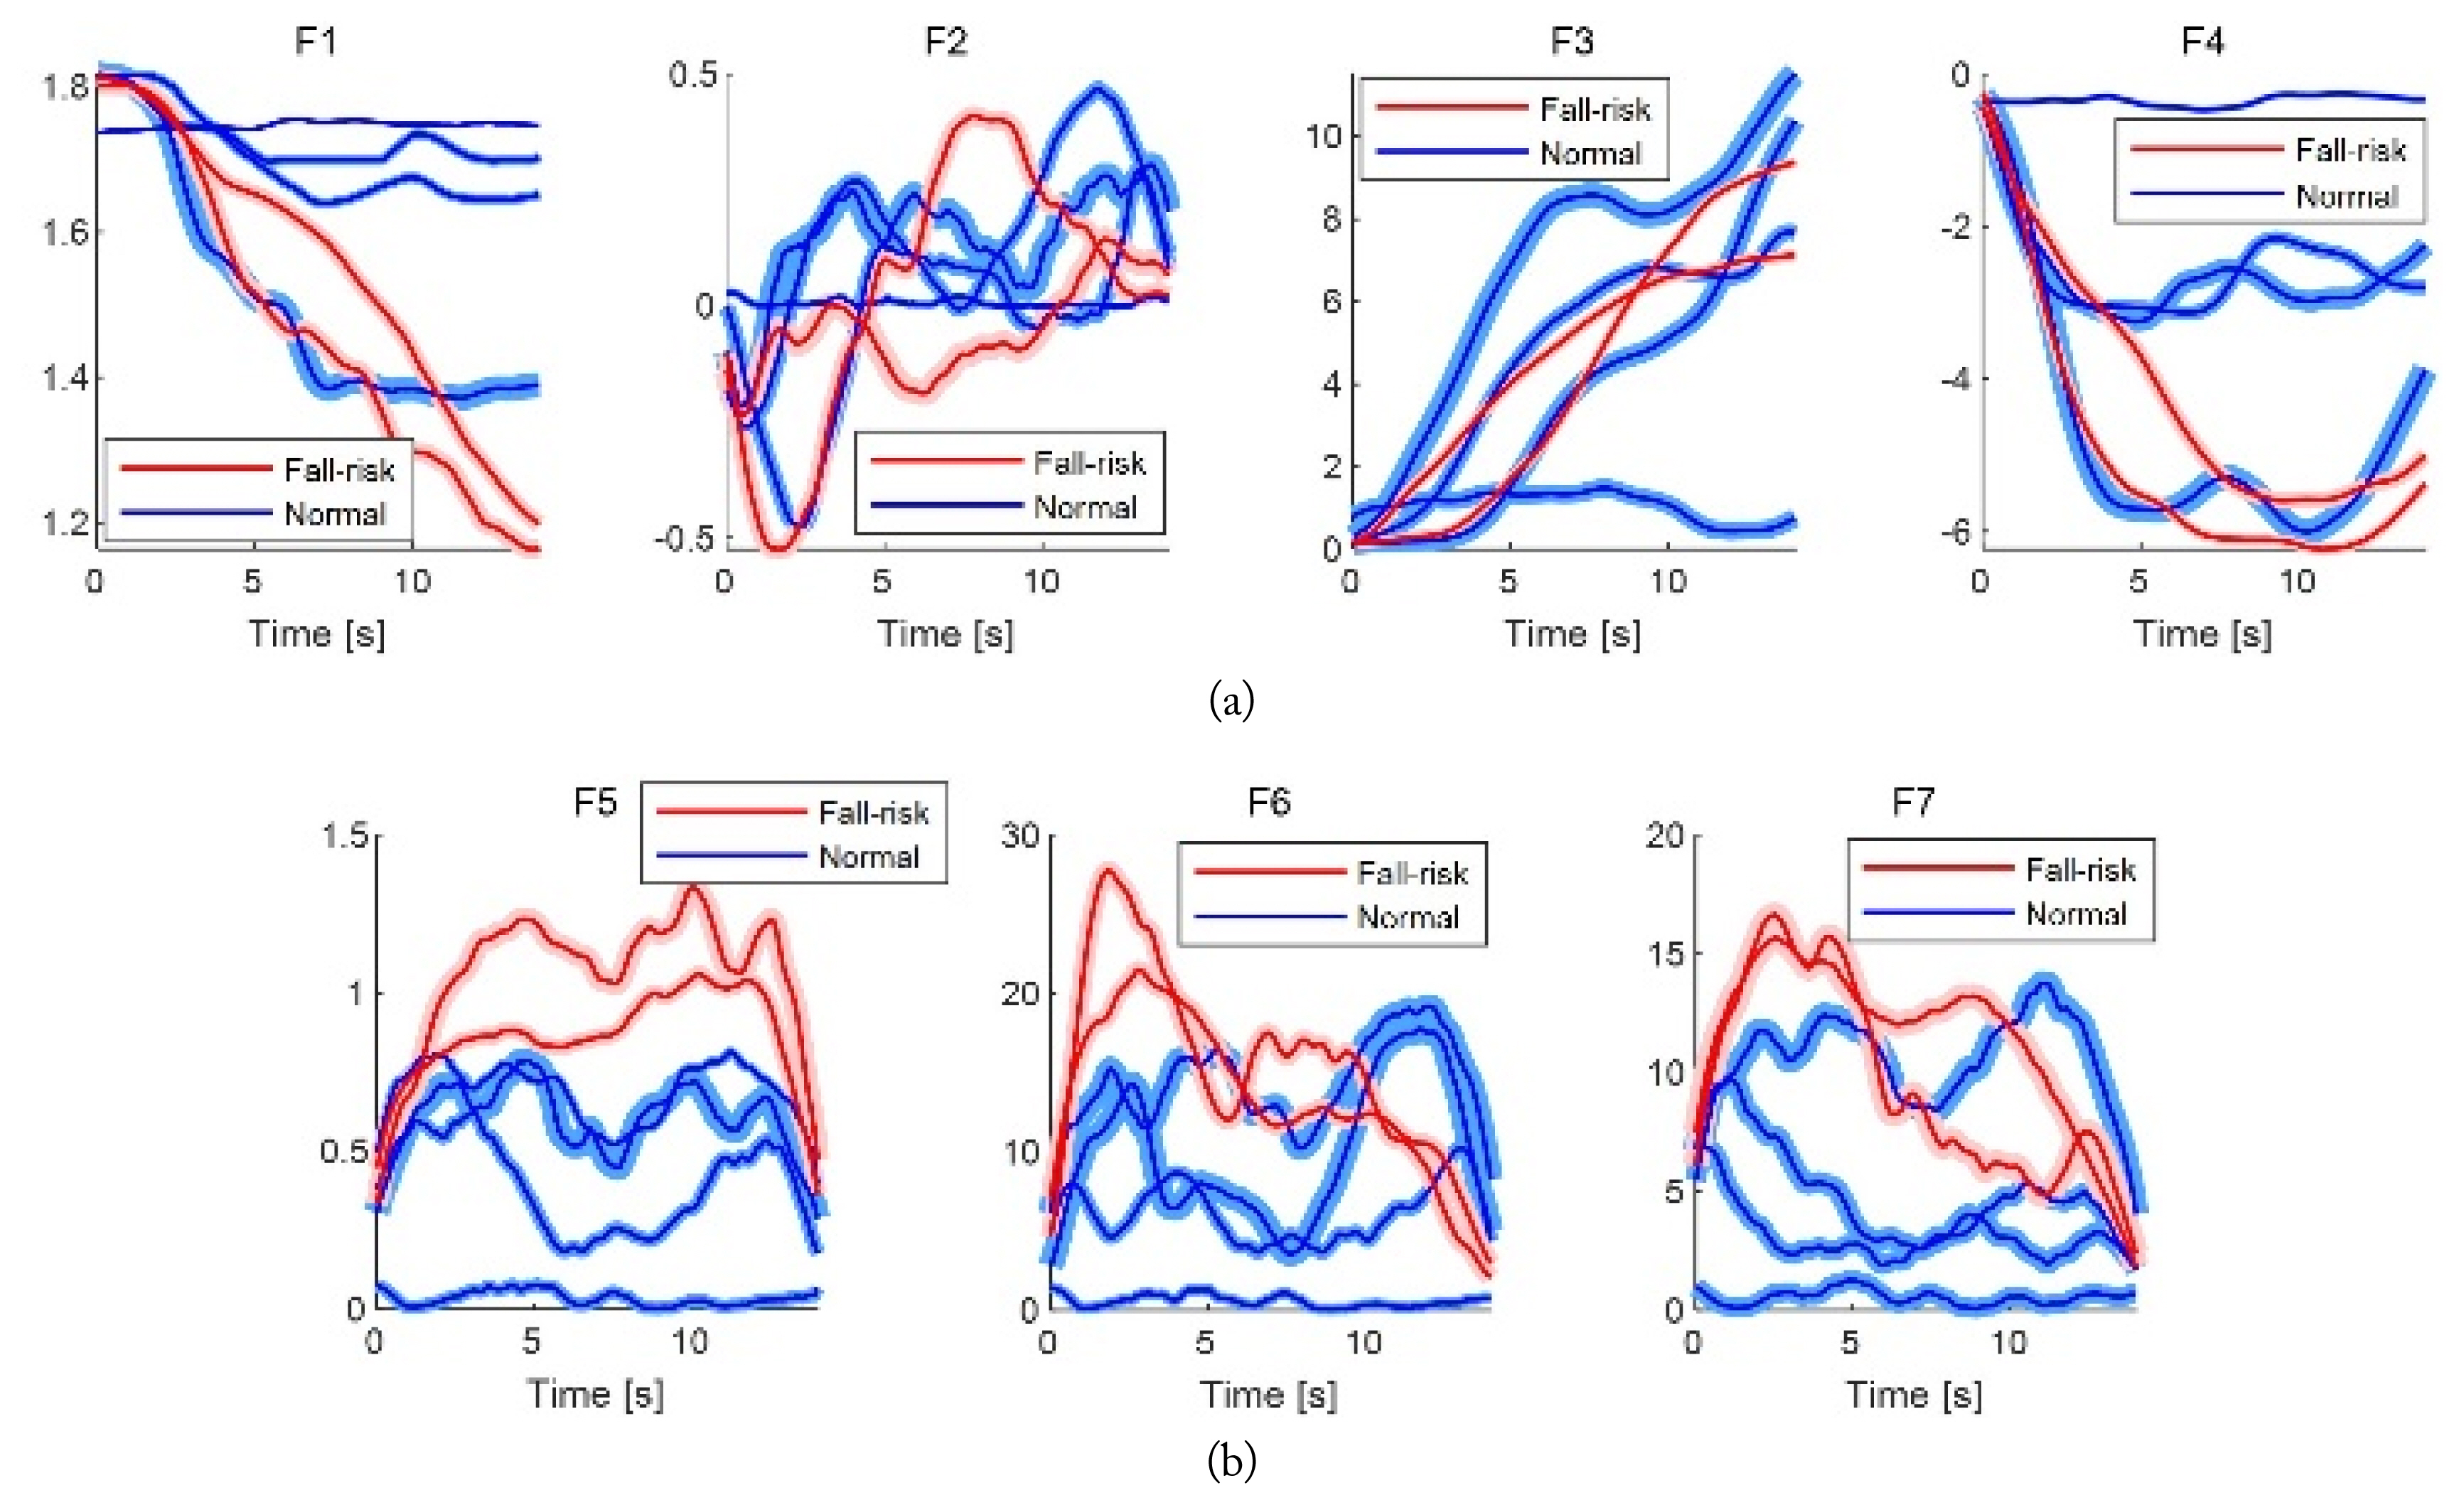
As previously mentioned, it is difficult to detect the sitting-up movement by only quantifying the range, velocity, and movement, since information related to these factors keeps changing for each behavior. Therefore, comparisons must be conducted between the characteristic features with regard to time to determine the ways in which they change with each behavior. The comparison method presents the ratio of the standard deviation in thickness to the mean of each behavior for one characteristic feature in the form of a line. Fig. 11 depicts the comparisons of the characteristic features.
Fig. 11 indicates that the new characteristic features are better able to distinguish risk behaviors from daily activities than the conventional characteristic features. Moreover, since this problem is directly related to daily life, it is crucial to accurately detect the start and end of the motion to ensure a prompt response. Notably, the start and end sections cover 10%–30% and 70%–90% of the total behavior time, respectively. Tables 4 and 5 list the mean and standard deviation of the start and end of all behaviors with regard to the characteristic features.
The t- and p-values were obtained to determine the degree of separation between the risk behaviors and daily activities. Table 6 lists the mean, standard deviation, t-value, and p-value of the risk behaviors and daily activities.
The results show that using the new characteristic features is more advantageous than using the conventional features in terms of distinguishing risk behaviors. Table 6 shows that the range width, activity area, and non-activity area are ideal characteristic features for classifying risk behaviors from daily activities in the start section, whereas the nearest range, accumulated negative velocity, and range width are appropriate characteristic features that distinguish them in the end section. Furthermore, the change aspect of the characteristic features over time is confirmed, indicating that they behave differently for each behavior. This points to the requirement for a time series data analysis.
3. Model Structure
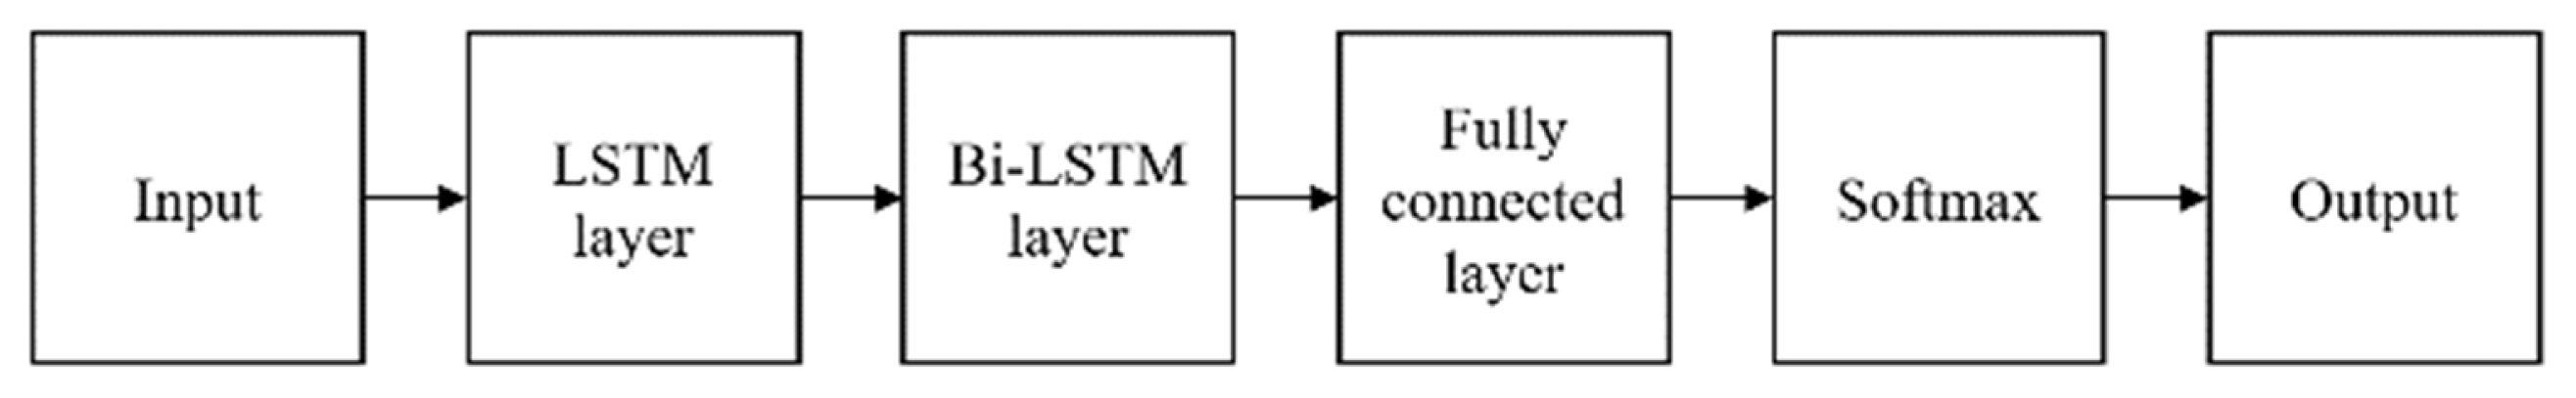
This study utilized the deep learning toolbox included in MATLAB 2021a and employed the bidirectional long short-term memory (Bi-LSTM) network to conduct the time series analysis. Notably, the characteristic features over time are considered the input for the Bi-LSTM model, whereas the output is a binary classification model that predicts the fall risk for each sequence. The proposed network includes an input layer, an LSTM layer, a Bi-LSTM layer, a softmax layer, and a classification layer, as shown in Fig. 12. Table 7 lists the size and properties of the layers of Bi-LSTM. Furthermore, the state activation function is a hyperbolic tangent, the gate activation function is a sigmoid, the batch size is 8, the learning rate is 10−3, and the optimizer is Adam. The Bi-LSTM network was trained using an NVIDIA GeForce RTX 2060 GPU.
4. Individual Behavior Experiments
The total individual behavior data was divided into five groups with equal labeling ratios. The groups were divided at a 6:4 ratio into training and testing data for model learning and estimation. Furthermore, leave-2-group-out cross-validation was conducted to evaluate the performance of the 10 dataset combinations. Unfortunately, since all the data were obtained through experiments, the validation data could not be used due to the small amount of data. An answer was deemed correct if more than 95% of the behavior sections matched.
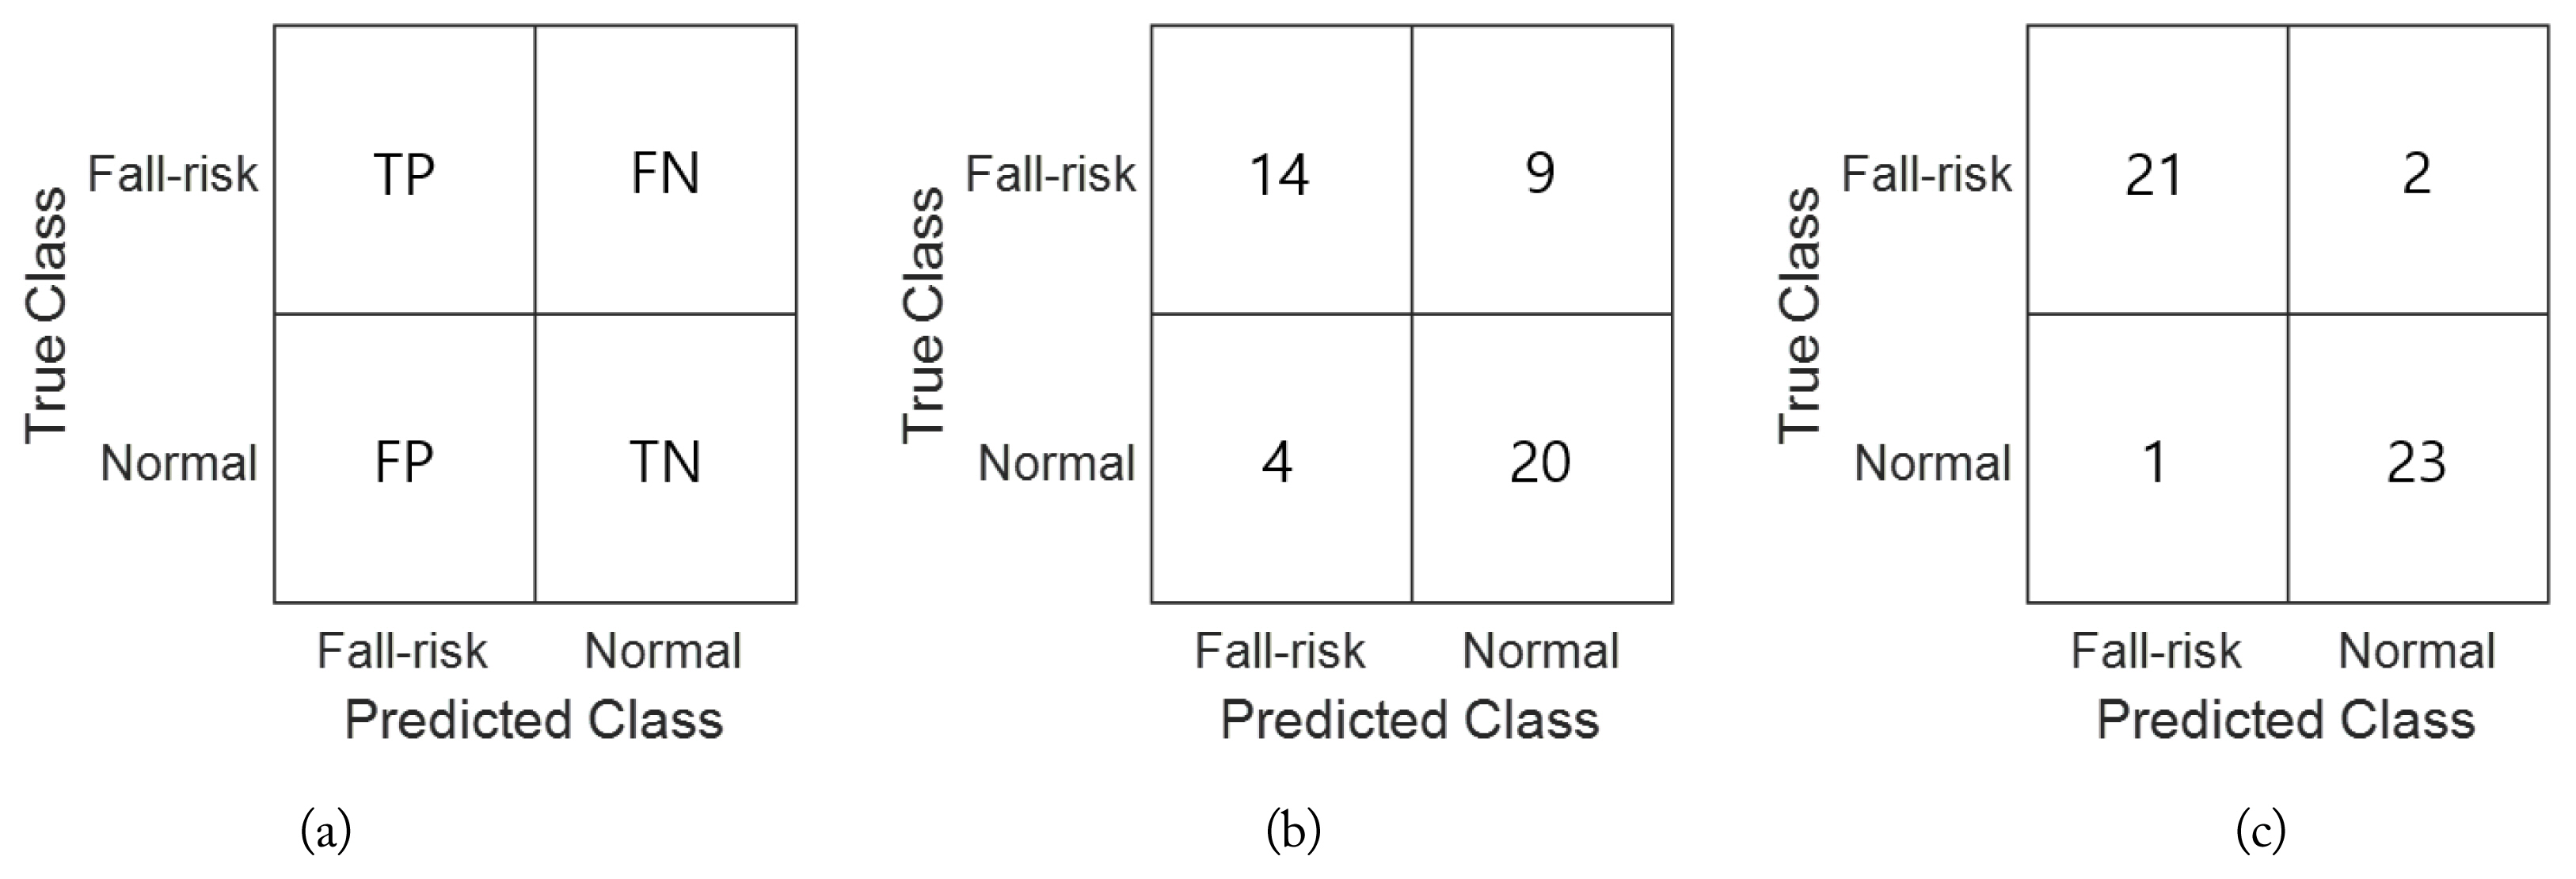
Subsequently, the confusion matrix was drawn, where true positive (TP) predicts the risk behavior data as risk behavior, true negative (TN) predicts daily activity data as daily activities, false positive (FP) predicts daily activity data as risk behavior, and false negative (FN) predicts risk behavior data as daily activities. The following equations were deployed to calculate accuracy, recall, and precision using the confusion matrix:
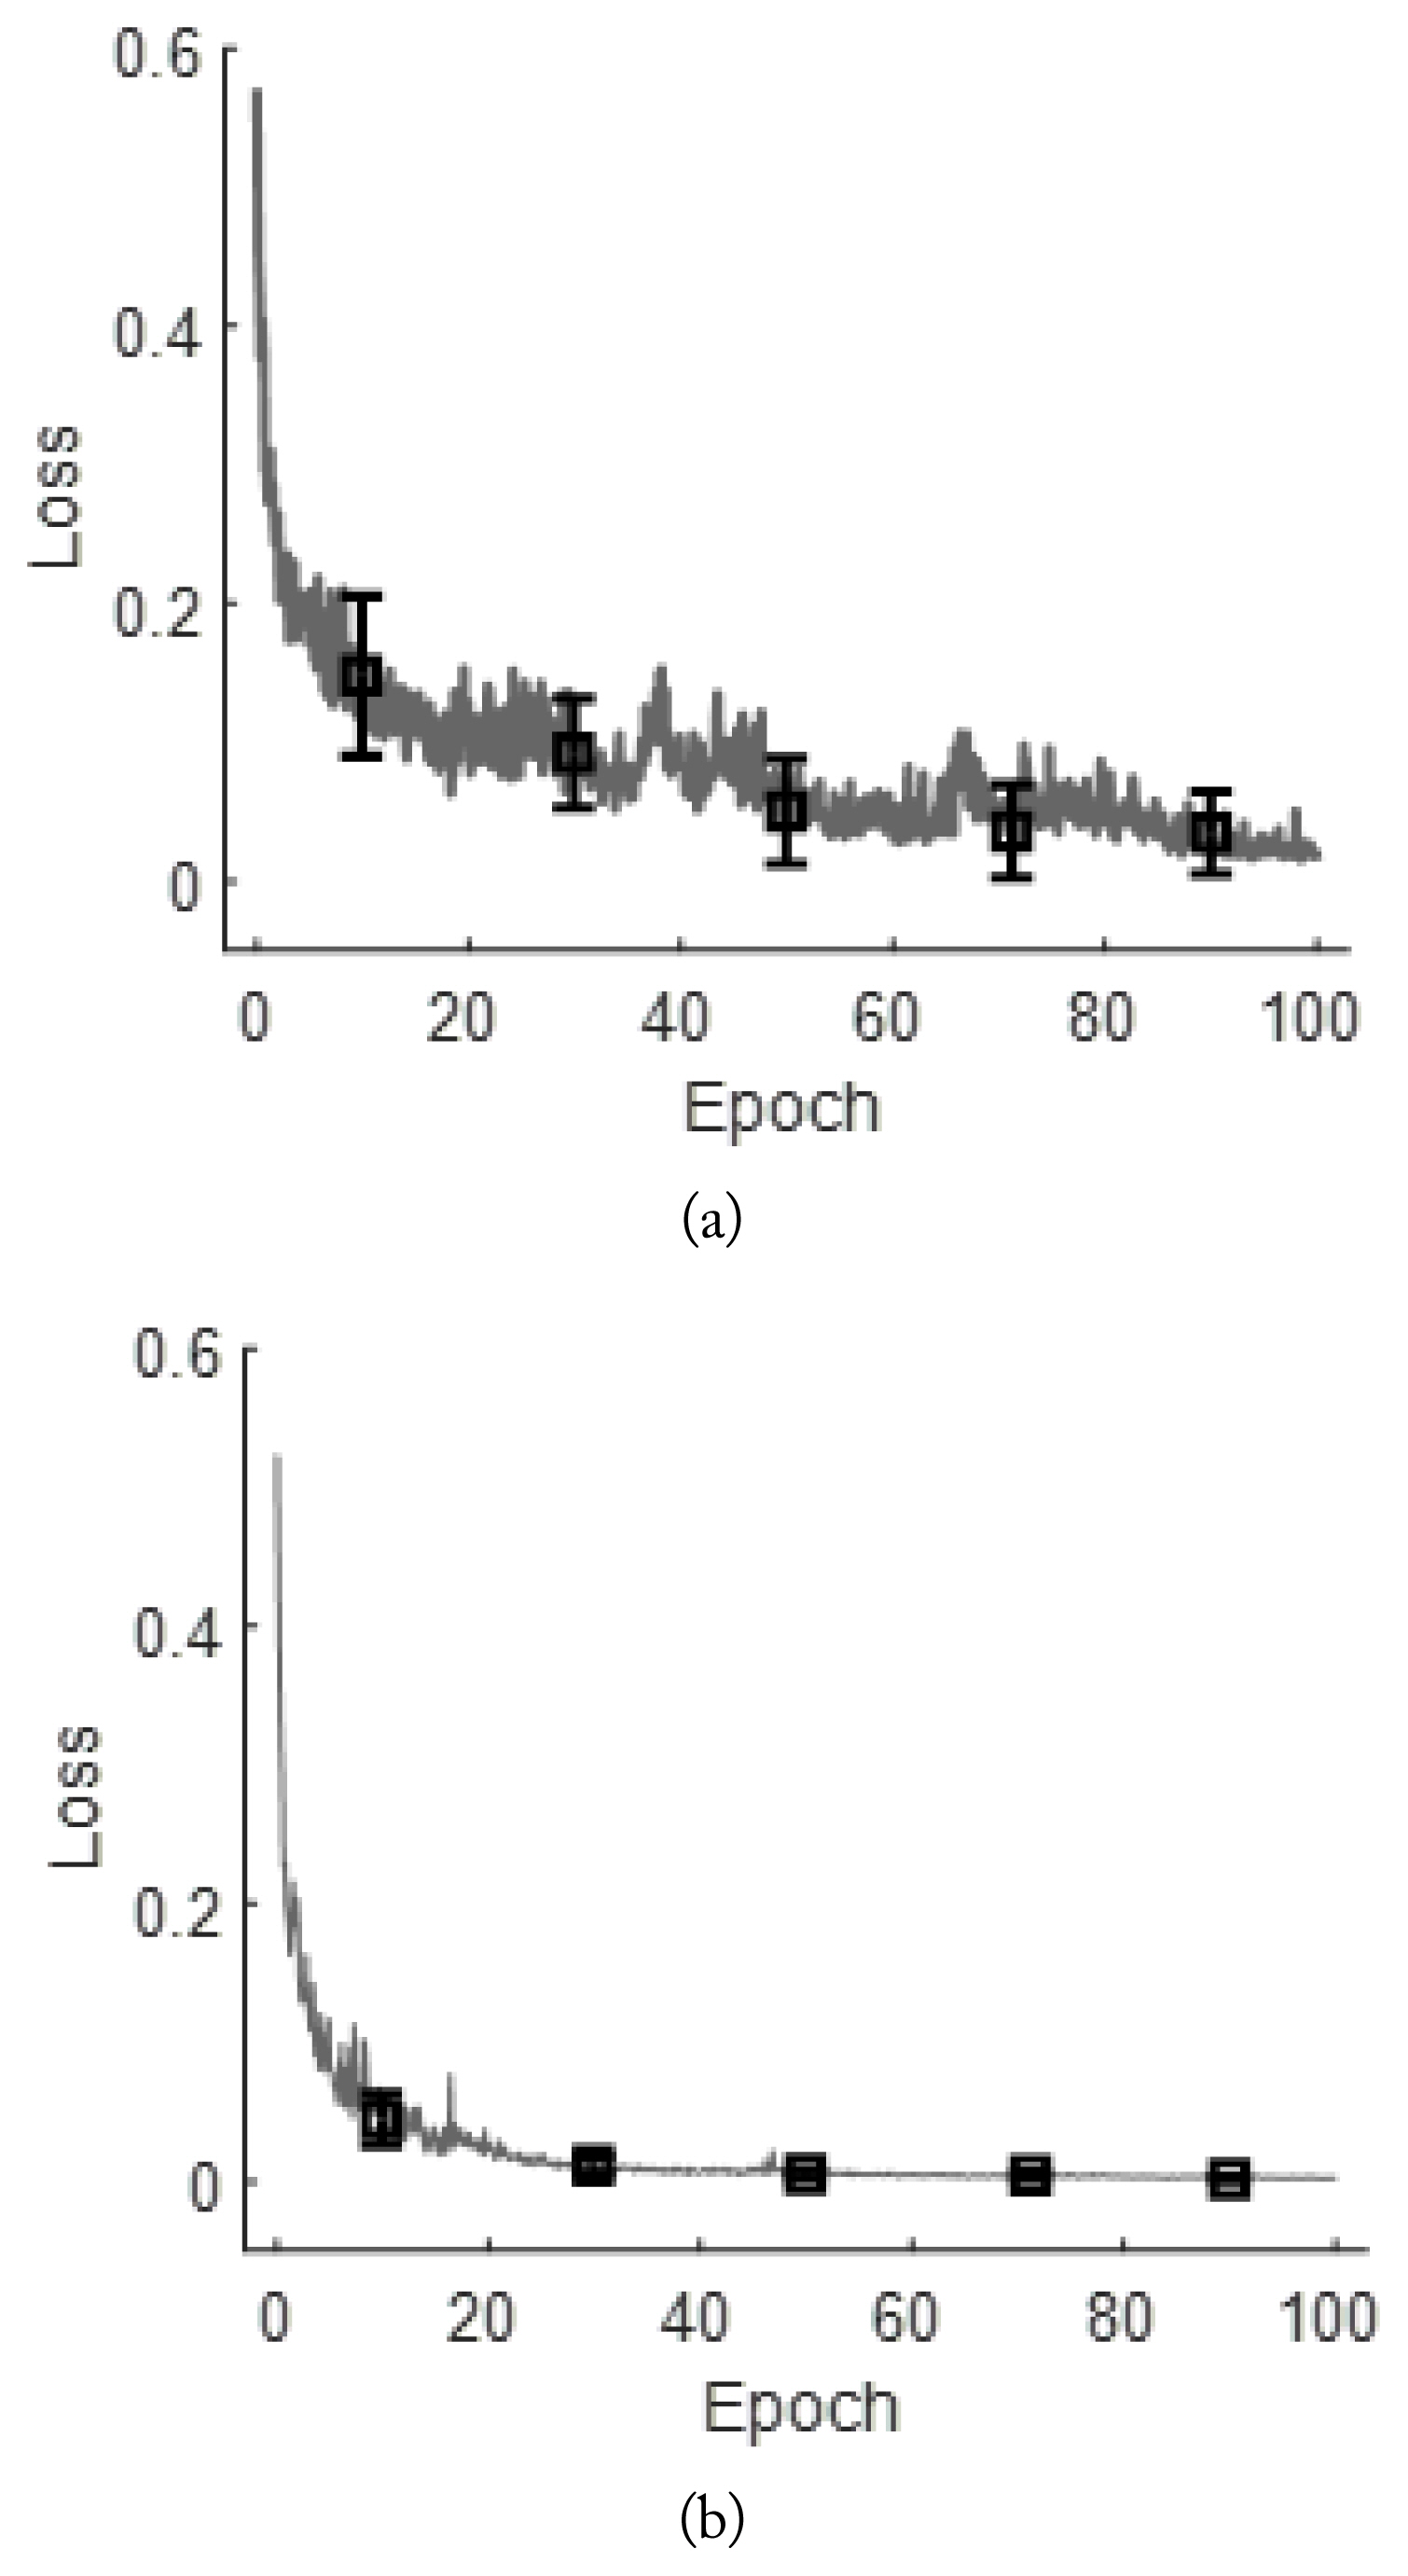
During training, the mean and standard deviation loss of each epoch were recorded to exhibit the stability of learning. Fig. 13 presents the mean and standard deviation loss on cross-validation, where the training process that considered only four features seems more unstable than the one trained using the seven features. However, the average loss and the standard deviation of loss show an overall reduction.
Fig. 14 depicts the basic configuration of a confusion matrix, as well as examples of confusion matrices in which only four conventional features and seven features, including the newly added features, were learned. Table 8 shows the mean and standard deviation indicating the performance achieved by training and testing the model for each dataset combination. Additionally, the learning performance of the conventional four features and the seven features, which include the new features, are presented. The values noted in parentheses in Table 8 denote the results obtained using only the conventional characteristic features. Notably, the models that accounted for the new characteristic features exhibit a high classification accuracy of approximately 94%.
This accuracy was about 20% lower when using only conventional characteristic features. In addition, since the accurate detection of risk behavior is directly related to life, recall—the ratio of identifying risk behaviors as risk—is crucial. The results show that about 89% of the recalls occur when using all the seven characteristic features, while only about 59%—about 30% lower—occur when using only four of the characteristic features.
5. Continuous Behavior Experiments
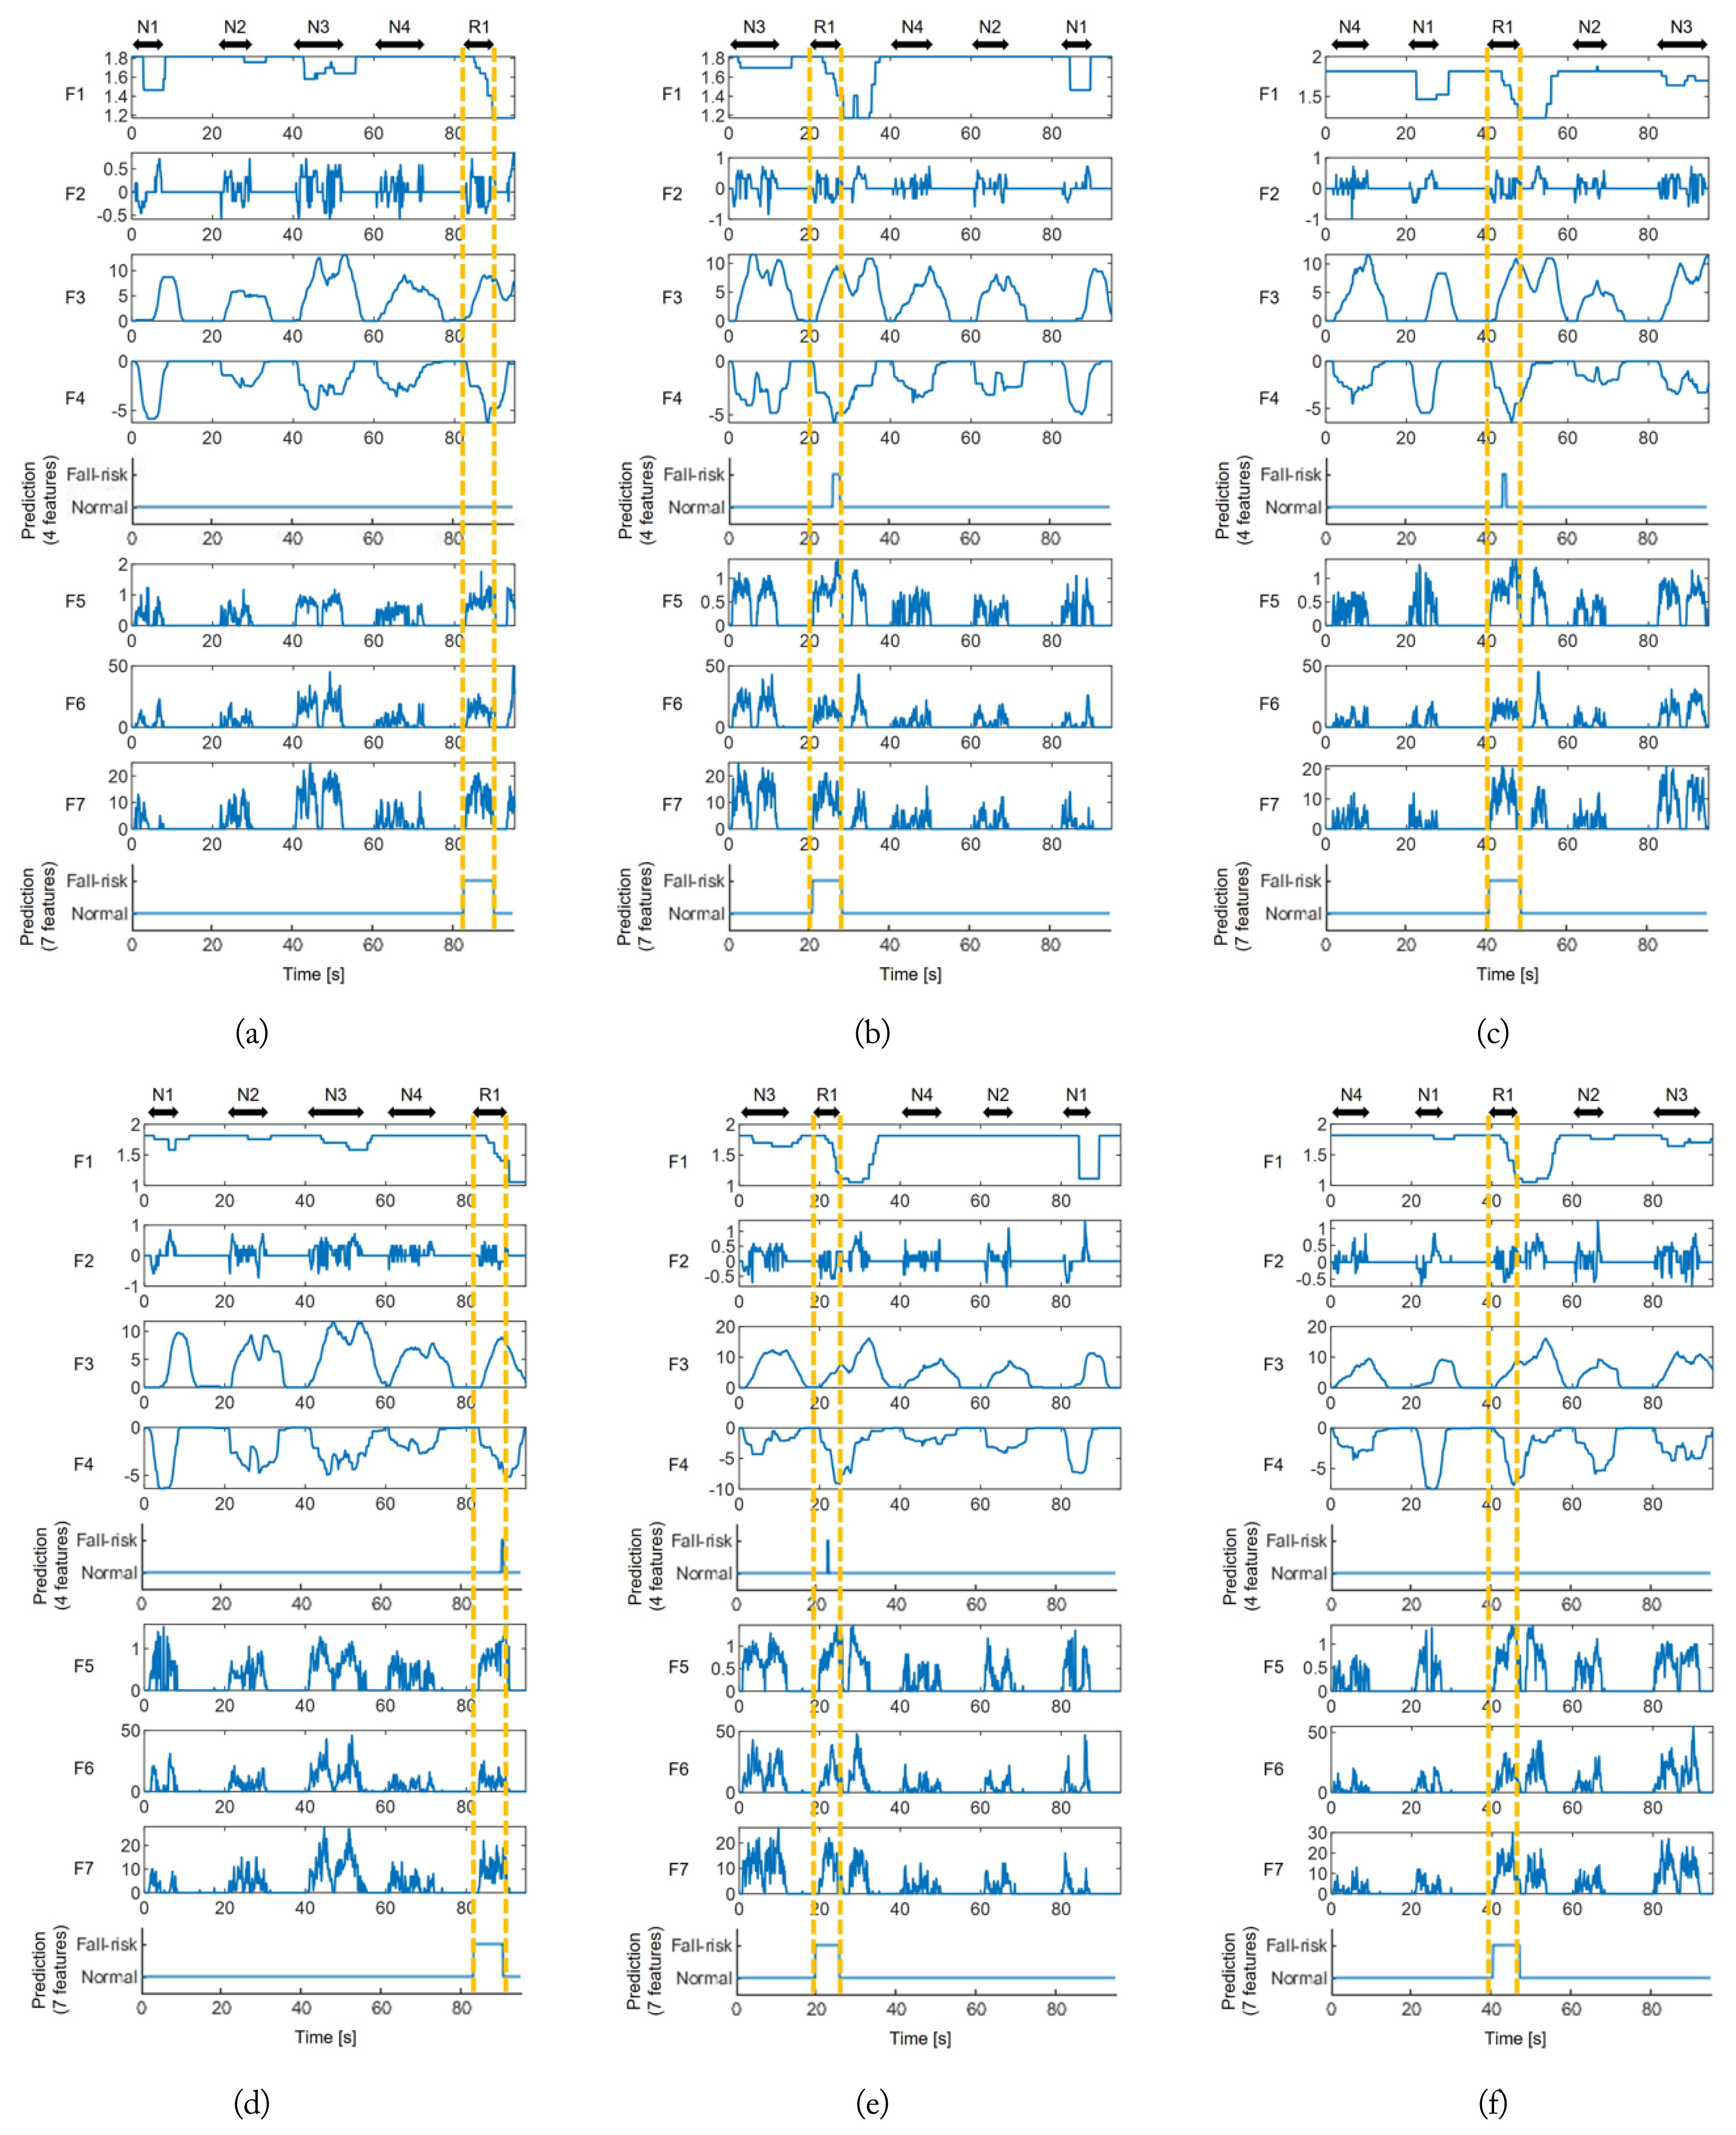
To obtain continuous behavior data performance, the model was trained using total individual behavior data. The resulting performance depicted the classification results over time. Performance was confirmed by considering the tendency of the characteristic features to change over time, the output of the models that learned only the four conventional characteristic features, and the output of the models that learned the seven characteristic features. Among the five behaviors, the beginning and end of those corresponding to risk behaviors are represented by yellow lines in Fig. 15, exhibiting the performance of the continuous behavior experiment data.
As shown in Fig. 15, the performance achieved on using the seven characteristic features, including the new features, is better than when using only the four conventional characteristic features.
Fig. 15 (b) and 15(c) indicate that, although the risk behaviors could be detected accurately, the beginning and end of the behavior do not match. In addition to the individual behavior experimental data, continuous behavior experiment data were used to verify the performance, confirming the accurate detection of risk behaviors by distinguishing them from daily activities.
V. CONCLUSION
This study proposed a novel monitoring system based on FMCW radar to detect risk behaviors with the aim of preventing and predicting falls in patients with severe mobility issues using novel characteristic features along with previously used ones. After developing the new characteristic features based on the FMCW radar, a time-series analysis using Bi-LSTM was performed to identify the characteristic features’ tendencies to change over time. Comparisons with models using only the conventional characteristic features demonstrated that the new characteristic features significantly contributed to the accurate detection of fall risk behavior. Accuracy increased by approximately 20%, and recall by around 30%. However, although the proposed method exhibited improved accuracy, it still needs to account for various real-life situations and requires the construction of additional systems, such as alarms or caregiver support, before being implemented for practical use.
A limitation of this study is that it classified and detected only the behaviors of sitting up and sitting at the side of the bed as risk behaviors. However, there are various other risk behaviors that can lead to falls. Another limitation is that only two subjects were used to demonstrate the effectiveness of the proposed method. Although the behavioral models examined in this study are simple, and individual behavior experiments were conducted in several independent trials, more experiments reflecting the activities of various kinds of subjects are necessary to establish the effectiveness of this method. Therefore, future studies must focus on adding different groups of risk behaviors that lead to falls and conducting experiments using huge datasets comprising many participants.