


I. Introduction
Sleep occupies nearly a third of a humanŌĆÖs lifetime, constituting an important aspect of life. Sleep helps to maintain human beingsŌĆÖ mental and emotional health [1]. Thus, it is important to get an adequate quality of sleep for a sufficient amount of time. Factors that interfere with sound sleep include environmental factors as well as sleep disorders, such as sleep apnea, restless legs syndrome, and narcolepsy [2, 3]. These factors may diminish the quality of sleep, and if they persist for long, they may induce attention deficit disorders, reduced exercise and metabolic capacity, and depression [4ŌĆō9]. Thus, sleep conditions must be monitored effectively to maintain a healthy life through a high quality of sleep [10, 11].
Sleep states are currently mostly monitored using polysomnography (PSG) [12]. PSG utilizes various sensors to measure biosignals, such as brainwaves, electrocardiogram and electromyogram, abdominal respiration signals, and eye movements of patients, and it is combined with video recordings to analyze the behavior of patients during tests. However, PSG is not suitable for patients with skin diseases because of the various sensors directly attached onto the body of the patients, which interrupt their sleep [13, 14]. There are also concerns about privacy infringement due to the need for simultaneous video recording [15]. Furthermore, because PSG is expensive and performed in a specialized sleep center rather than a comfortable, everyday sleeping space, patients are exposed to the so-called ŌĆ£first-night effectŌĆØ [16, 17], which refers to difficulty in reproducing their usual sleep state.
To reduce the environmental and financial burdens of existing PSG, simpler PSG equipment has been developed for home use. However, there are issues with this equipment, such as the complicated self-installation process and difficulties with manual reading of the results [18]. Thus, studies using radar have been conducted to reduce the burden of wearing multiple sensors and detect breathing disorders during sleep in a manner that requires no contact [19ŌĆō23]. Studies using machine learning methods to detect respiratory disturbance intervals, such as Random Forest [24], hybrid convolution neural network-long short-term memory networks [25], and support vector machines [26], involve a large amount of computation compared to non-machine learning algorithms, despite their differences and depending on the number of features. Furthermore, in cases in which data on fewer than 10 test subjects were used to verify the proposed algorithm [27ŌĆō31] or in which the experimental situation was not reported and no expert clinician participated in the experiment [27, 29, 31], the reliability of the proposed methodŌĆÖs performance may be low. Frequency-modulated continuous wave (FMCW) radar, used in this study, has advantages over other radar types in measuring biosignals such as respiration and heart rate because it involves the micro-displacement of the target object [32]. Furthermore, the advantages of low power consumption and relatively simple hardware implementation enable FMCW radar to be used conveniently at home [33, 34].
This study proposes a new method for detecting breathing disorders such as apnea and hypopnea that uses FMCW radar with a bandwidth of 3.75 GHz and a center frequency of 61 GHz in a non-contact manner without applying machine learning algorithms. According to the American Academy of Sleep Medicine (AASM) [35], apnea and hypopnea in the sleep state refer to cases in which the amplitude of the breathing signal decreases for at least 10 seconds by 90% and 30% or more, respectively, compared to that of the reference signal. Based on this definition, this study proposes a method of effectively extracting respiratory parameters from patientsŌĆÖ radar signals as measured using FMCW radar; it thereby detects sleep apnea and hypopnea, which are characterized by the degree and duration of the reduction in the amplitude of the respiratory signals. Radar and PSG signals were simultaneously measured in 85 patients suffering from sleep-related breathing disorders, and the accuracy of the proposed method for detecting breathing disorders during sleep was verified by comparing the signals of sleep apnea and hypopnea intervals detected by the radar sensor with the PSG results for the same episodes.
II. Methods
1. FMCW Radar
Radar is a technology that detects an object and identifies its information, such as its direction of movement and the distance moved, by transmitting electromagnetic waves and receiving the waves as they reflect off the object. Radar is categorized into several types depending on the modulation methods of the transmitted and received signals. This study used FMCW radar, in which the frequency of the transmitted signals increases linearly over time. FMCW radar can obtain the desired information from the detected object by analyzing the frequency differences between the transmitted and received signals because the frequency of the transmitted signal constantly increases over time. The transmitted signal ms(t) and the received signal mr(t) can be represented as in Eqs. (1) and (2). t, td, Tc, fc, M, and BW refer to the scan index, time delay between the transmitted and received signals, chirp duration, sampling frequency, magnitude of the radar signal, and frequency bandwidth, respectively.
In this case, the transmitted signal is called a chirp, and the FMCW radar continuously propagates the chirp signals. After mixing the transmitted signal ms(t) and the received signal mr(t) and undergoing a low-pass filtering process, an intermediate frequency (IF) signal, x(t, n), is obtained:
where r, n, Fs, and ├ś refer to the distance between the object and the radar, the sample index of the chirp, the sampling frequency, and the phase component, respectively.
A discrete-time Fourier transform was applied to the IF signal to extract the magnitude M(t, rk) and phase P(t, rk) of the signal according to the distance. In this case,
r k = c 2 B W ┬Ę k ŌĆē ( f o r ŌĆē k = 0 , 1 , ŌĆ” N - 1 )
When a micro-displacement occurs in a stationary object at a specific distance rk, rk = rk + Δ(t), which can be represented as in Eqs. (7) and (8). Assuming a micro-displacement, Δ(t) << rk is satisfied. Thus, by applying the Taylor series approximation, it can be rearranged as follows:
When measuring a radar signal from a stationary person, Δ(t) can be thought of as a minute movement of the body caused by respiration or heartbeats. By analyzing the IF signal acquired from the FMCW radar, we can obtain information on biosignals such as respiration and heart rate.
2. Detection of Respiratory Signal
To accurately extract respiratory parameters from the signals measured by radar, it is important to correctly select the range bin in which the target is present. This is because incorrect selection of the range bin could result in a failure to extract accurate respiratory information due to the wrong radar signal being chosen.
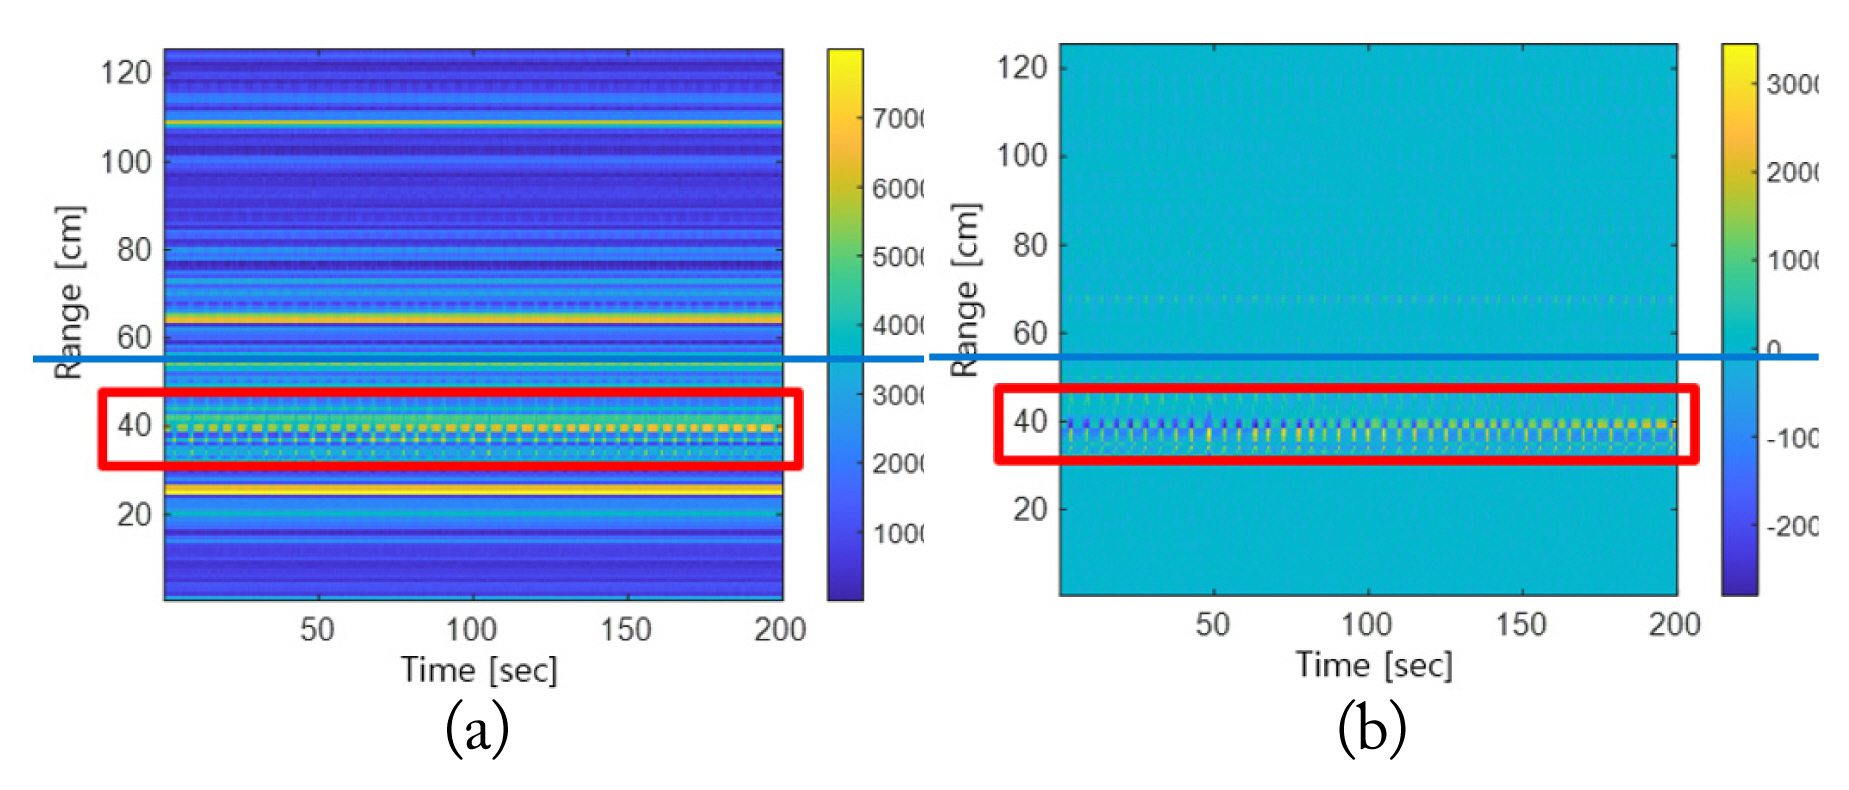
When a personŌĆÖs breathing signal is measured via radar, the signal is mixed with noise due to various external factors other than the specific range bin being present where breathing is detected. If the range bin is selected using only the magnitude of the radar signal without considering this, the range bin may be incorrectly selected owing to the clutter. Fig. 1 compares range spectrograms before and after removing the clutter from the same radar signals. The target is located within the range of around 40 cm, as shown in Fig. 1. Fig. 1(a) shows that the magnitude of the signals with clutter is higher than that of the signal reflected from the target before clutter removal. Thus, when clutter is removed, most of the signals with clutter that have large magnitudes disappear, and the signals reflected from the target object are more clearly observed, as shown in Fig. 1(b). Thus, after removing the clutterŌĆöwhich would have affected the selection of the range binŌĆöfrom the radar signals measured, clear respiration signals were extracted.
The magnitude of the radar signal from which clutter is removed is defined as m(t). Typically, human respiratory signals fall within a frequency band of 0.1ŌĆō1.0 Hz. To remove unnecessary signals corresponding to other frequency bands, a bandpass filter in the frequency range of 0.1ŌĆō1.0 Hz was applied to m(t), which was defined as mfilter(t). With respect to the entire time of mfilter(t), the range Ymax with the largest average power value for each range was derived. The largest average power value of a specific range bin means that the power of the signal assumed to be the respiration signal in that range is the largest. Ymax was utilized to set the target range to
[ 1 2 Y m a x ~ 2 Y m a x ]
3. Baseline Settings and Detection of Breathing Disorders
The criteria for determining breathing disorders during sleep, such as apnea and hypopnea, are the degree of reduction in the size of respiratory signals and the duration of the reduction interval. Thus, a baseline is set to detect breathing disorders by determining the degree of reduction in the respiratory signals. The baseline value is the average breathing depth of normal breaths, which becomes the standard for distinguishing between normal and abnormal breathing. To set the baseline, MŌĆ▓(t) was first defined by using the magnitude of R(t), the respiratory signal. As the fluctuation range of the signals was not constant owing to external factors that interfered with the signals measured, the absolute value was calculated and used.
In accordance with Eq. (10), the peak of MŌĆ▓(t) was detected, which was defined as P(t). In this case, only the peak values were extracted and used instead of all the signal values of MŌĆ▓(t) to reduce the computational load for data that must be measured overnight. Furthermore, the variability of the respiratory signals can be expressed using only the peak values, which enables the analysis to be validly conducted using a small amount of data. Fig. 3 shows MŌĆ▓(t) and P(t).
The values of P(t) in the upper 85th percentile, excluding the zero value, were set to AB, the respiratory signal baseline, to reduce the baseline contributions of apnea or hypopnea and reflect more normal respiratory signals.
Through the baseline determined as described above, abnormal and normal respiration intervals were distinguished. The interval in which P(t) was less than a certain constant k times the baseline was defined as the interval of reduction in respiratory magnitude, ╬Ę(t). k refers to the degree of reduction in the respiratory signal amplitude compared to the baseline, which is typically a value of 0.4. This was experimentally derived by analyzing the respiratory signals of all test subjects and averaging the degree of amplitude reduction in the breathing disorder interval compared to the normal breathing interval.
Using the AASMŌĆÖs criteria for identifying breathing disorders during sleep, breathing disorders were confirmed only when the abnormal breathing interval, ╬Ę(t)=1, lasted continuously for 10 seconds or more. Thus, the breathing disorder interval ultimately detected was defined as ╬ĘŌĆ▓(t).
Fig. 4 illustrates the breathing disorder interval, which is derived from the duration of the respiratory signal reduction interval. As the size of a respiratory signal increases and decreases in accordance with inhalation and exhalation during normal breathing, many breathing disorders are detected without considering the duration of the normal breathing interval, as shown in Fig. 4(b). However, if the duration is considered, as shown in Fig. 4(c), the only interval that can be detected is identical to the actual breathing disorder interval, excluding all normal breathing intervals.
III. Experimental Results
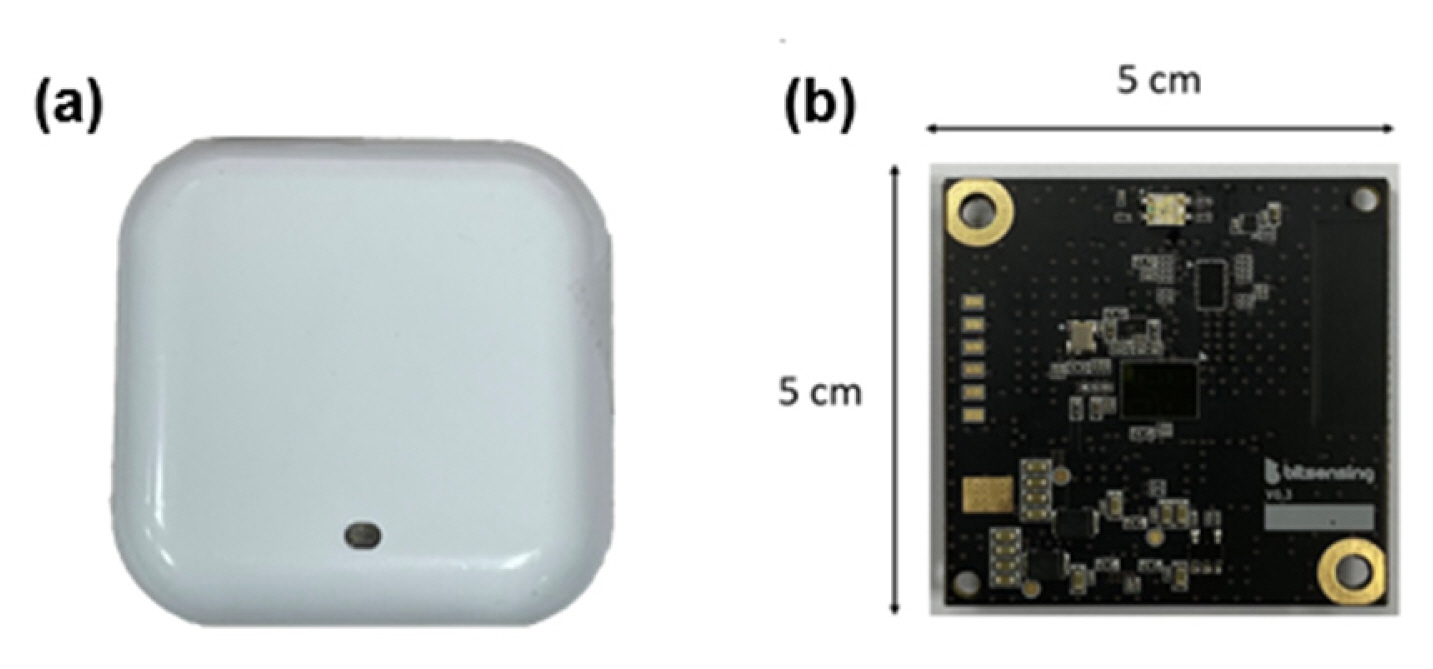
All processes with all test subjects were recorded using the FMCW radar system (Bitsensing Inc., Seongnam, South Korea; https://bitsensing.com) shown in Fig. 5. Fig. 5(a) and 5(b) indicate the exterior appearance of the radar and its internal board, respectively. Table 1 presents the parameters used in the radar.
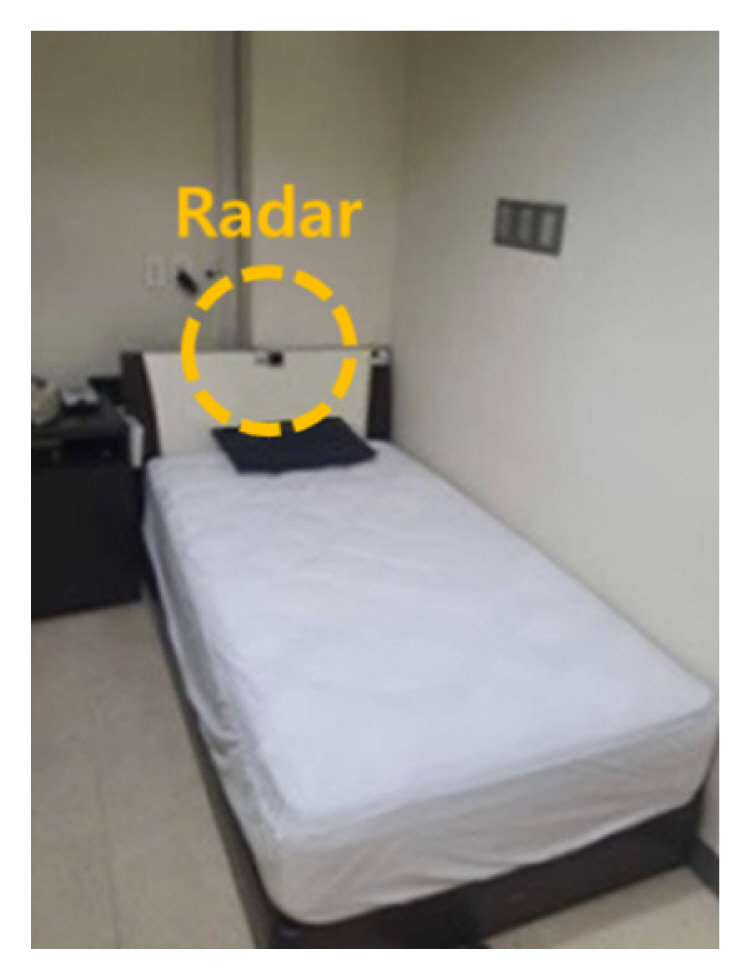
Fig. 6 presents the experimental environment. The radar was located by the head of each test subject, as shown in the same figure. The radar installed was pointed towards the upper part of each test subjectŌĆÖs body at an angle of 45┬░ in the vertical direction, and the distance between the radar and the upper body of the test subject was approximately 40 cm.
The test subjects were recruited from adults with symptoms of sleep breathing disorder who visited the Polysomnography Laboratory at Pusan National University Yangsan Hospital. Data was collected from a total of 85 subjects, and all experiments were conducted in the Polysomnography Laboratory at Pusan National University Yangsan Hospital. The radar and PSG signals were simultaneously measured for all test subjects during the entire sleep time. All PSG data were reviewed jointly by clinicians. All experiments were conducted with the approval of the Institutional Review Board of Pusan National University Yangsan Hospital. Written informed consent was obtained from all subjects participating in the experiment, which was conducted in accordance with the relevant guidelines and regulations.
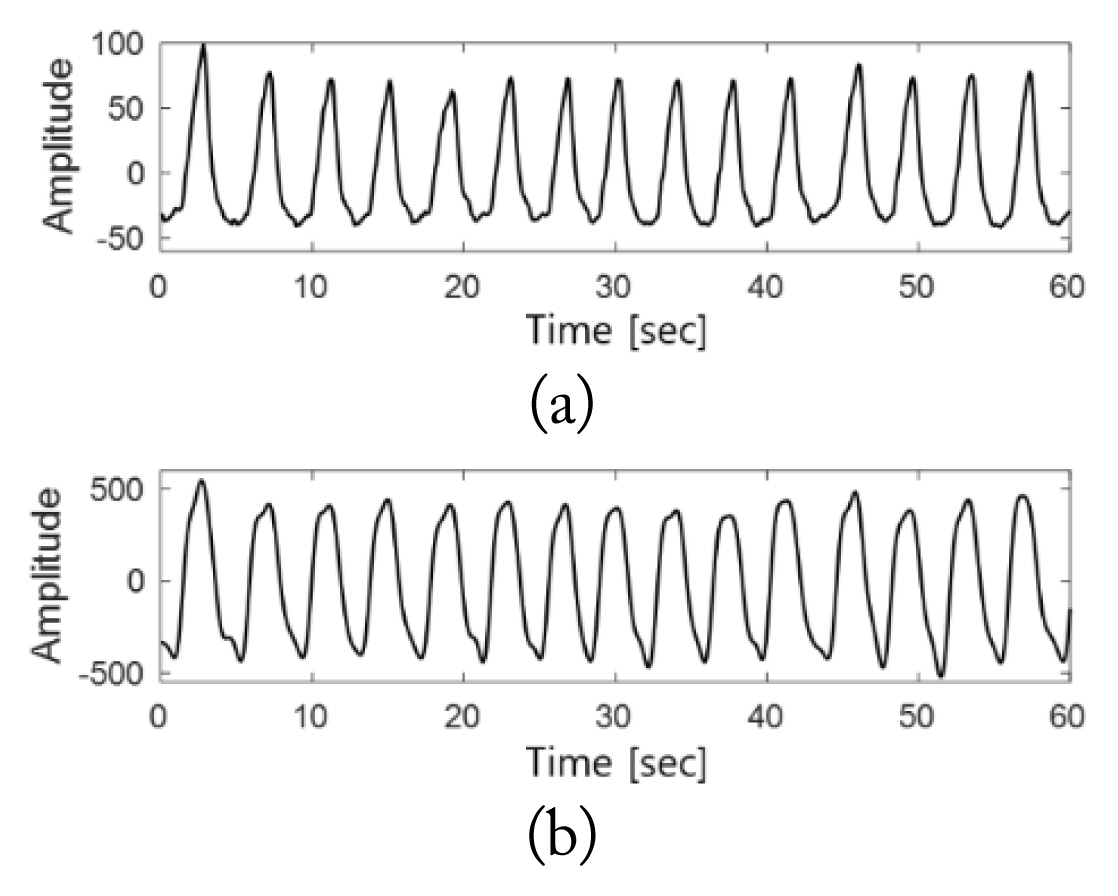
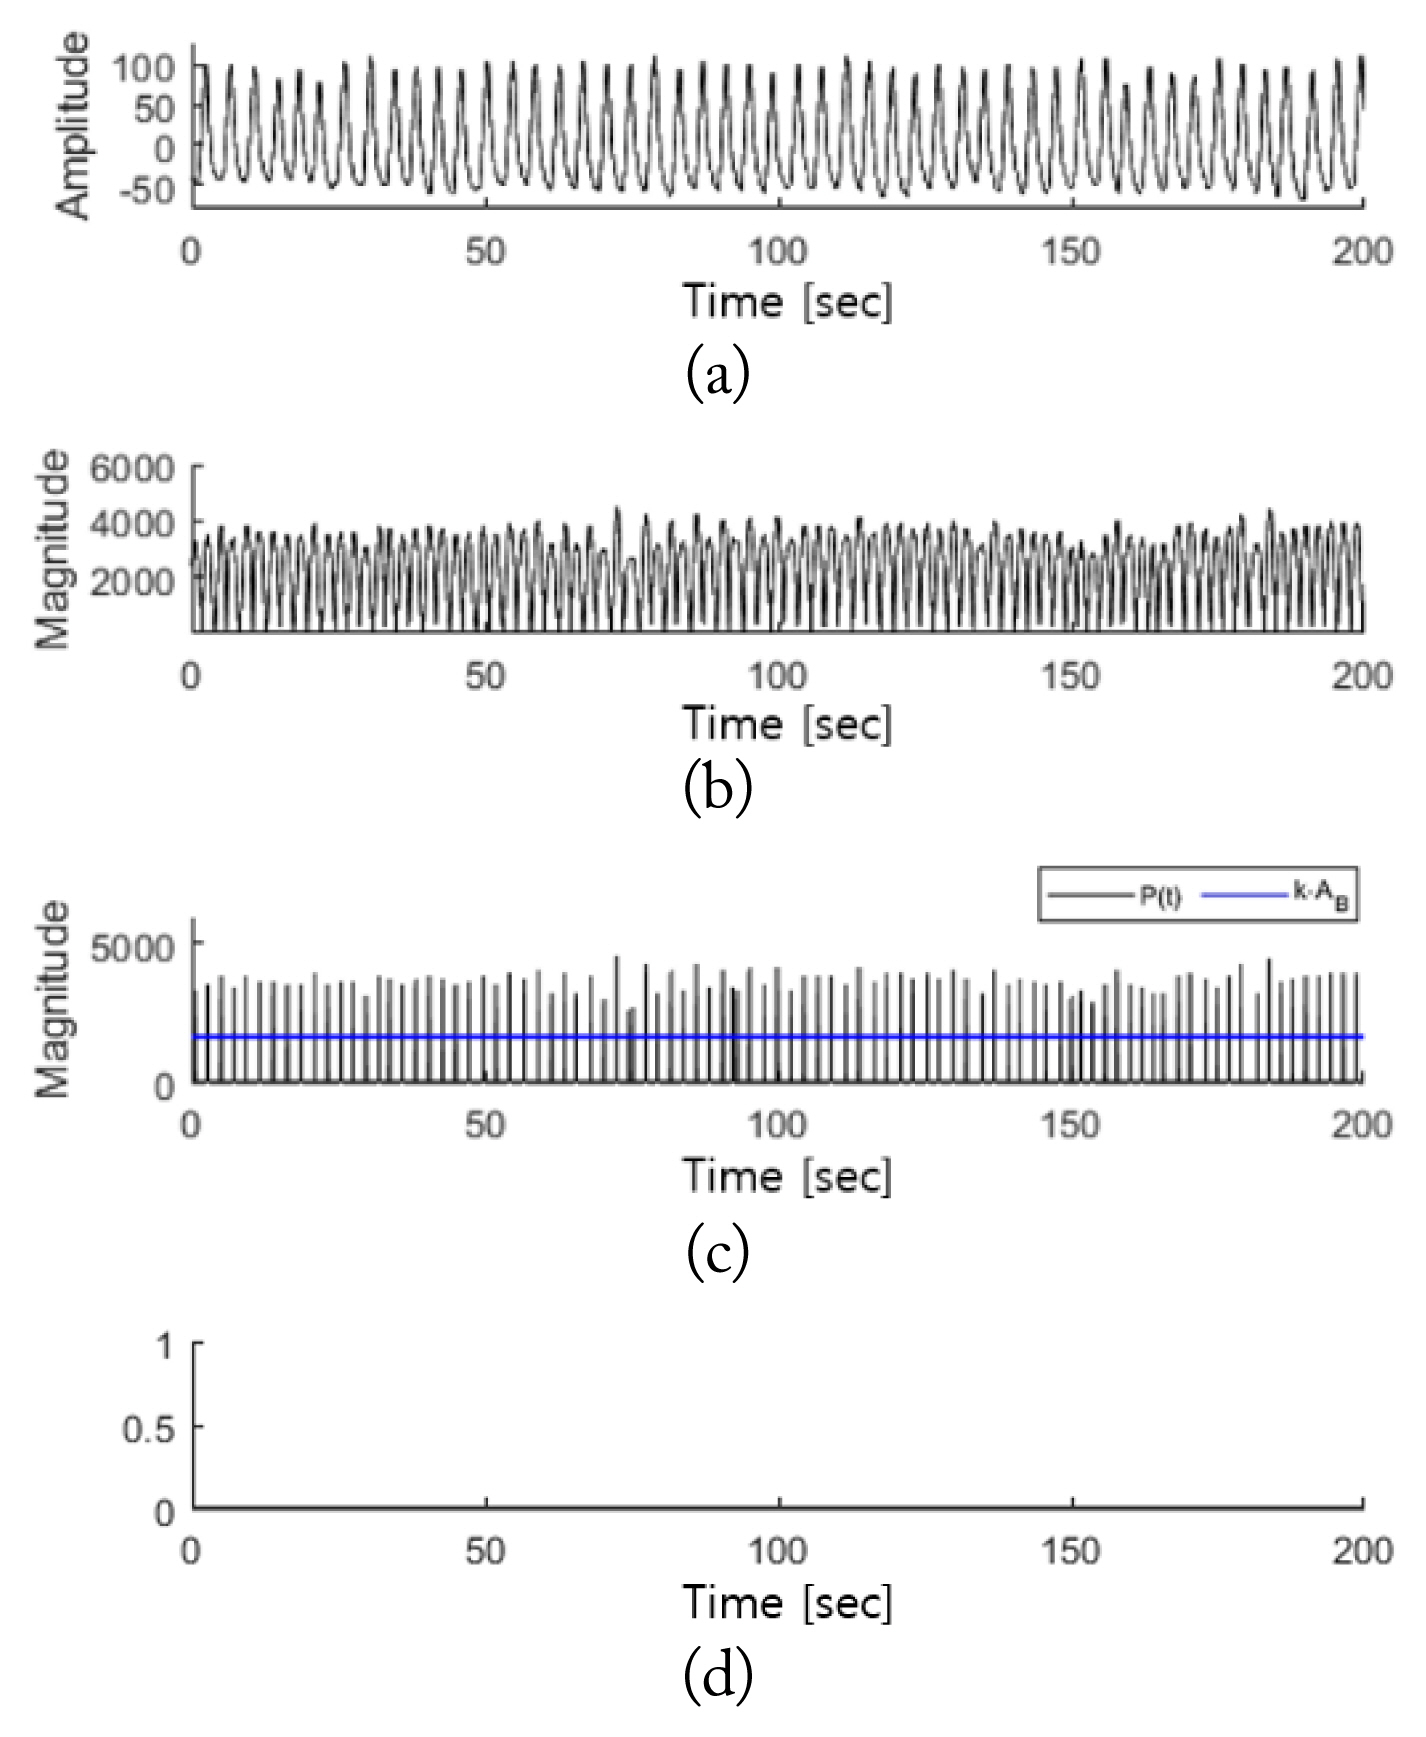
Fig. 7 presents the detection results of the breathing disorder section for normal breathing. Signals were obtained when the sleep of a test subject was stable without any movement. A comparison between Fig. 7(a) and 7(b) shows that the radar signals appear to detect a respiration rate twice that of the PSG respiratory signals because the magnitude signals of the respiratory signals were used in the process of detecting the breathing disorder intervals. In the case of normal breathing, given that peak values above the baseline were observed at regular intervals, a breathing disorder interval was not detected, as shown in Fig. 7(d).
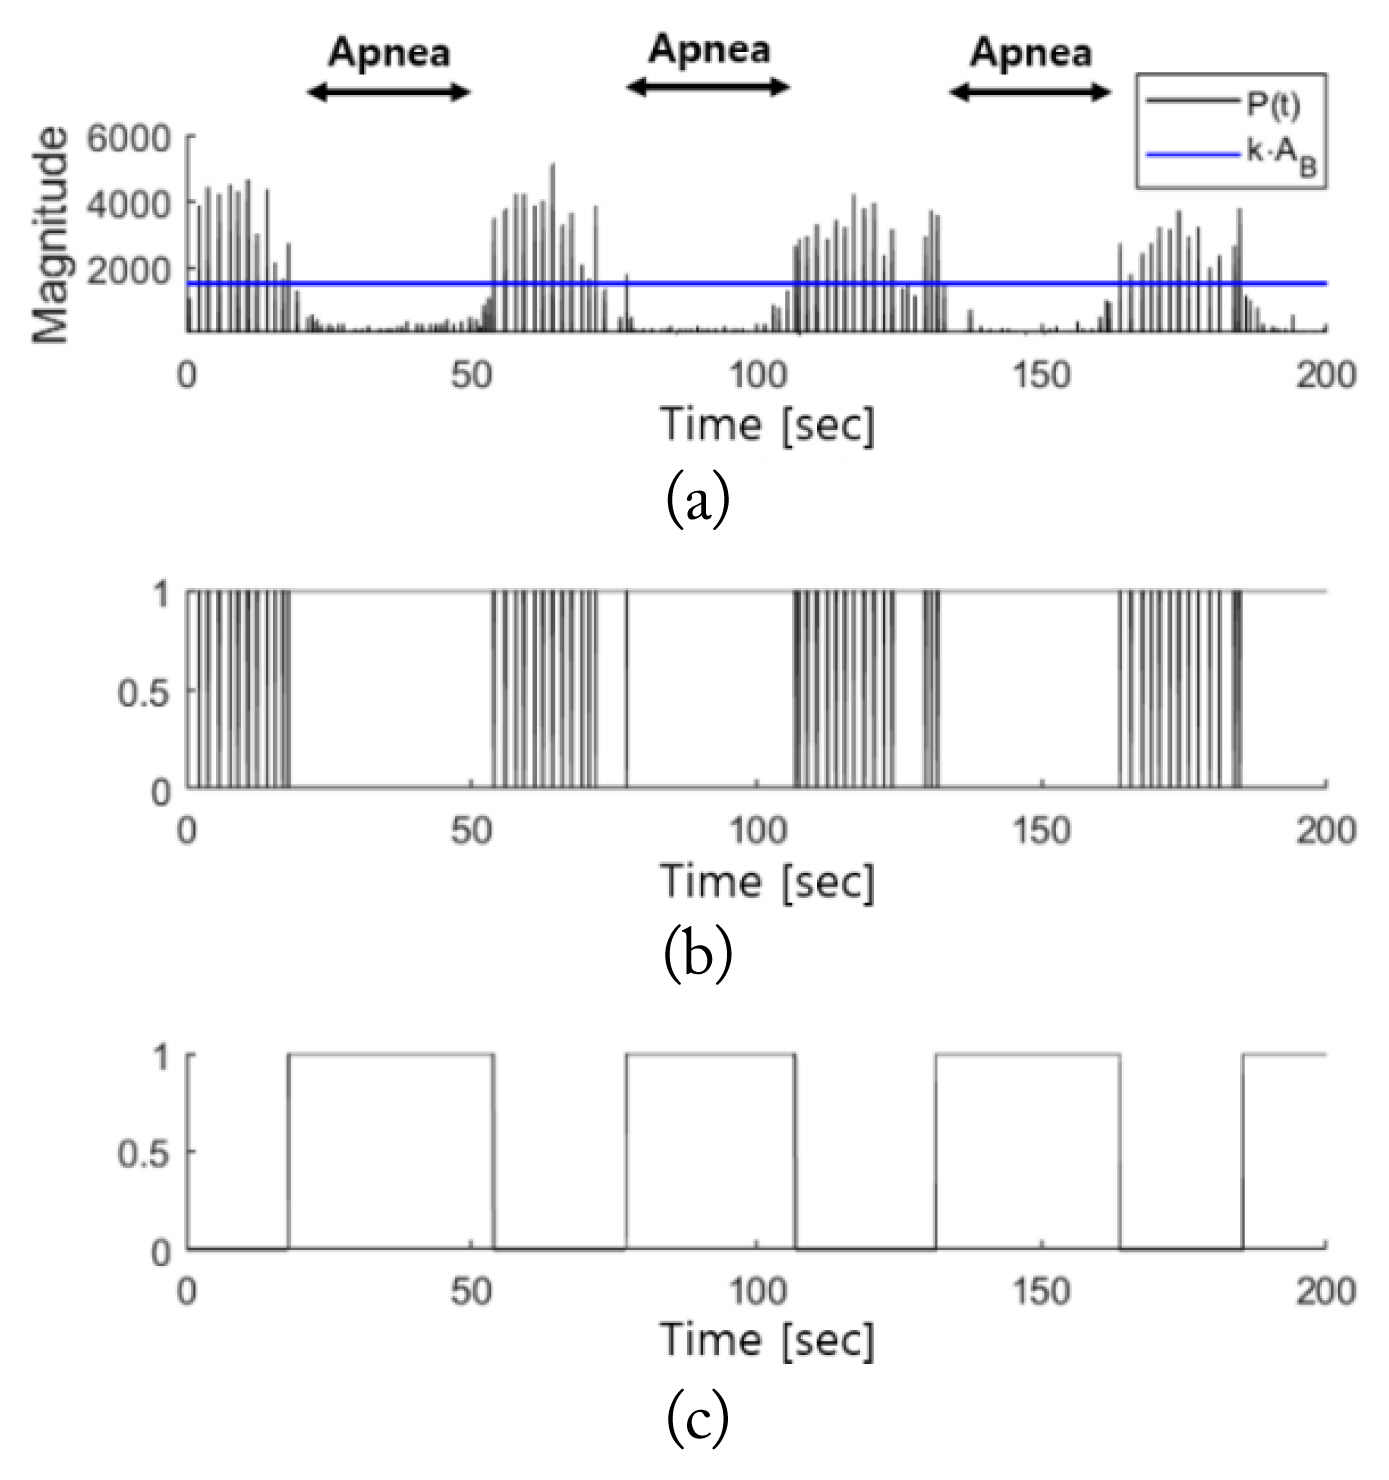
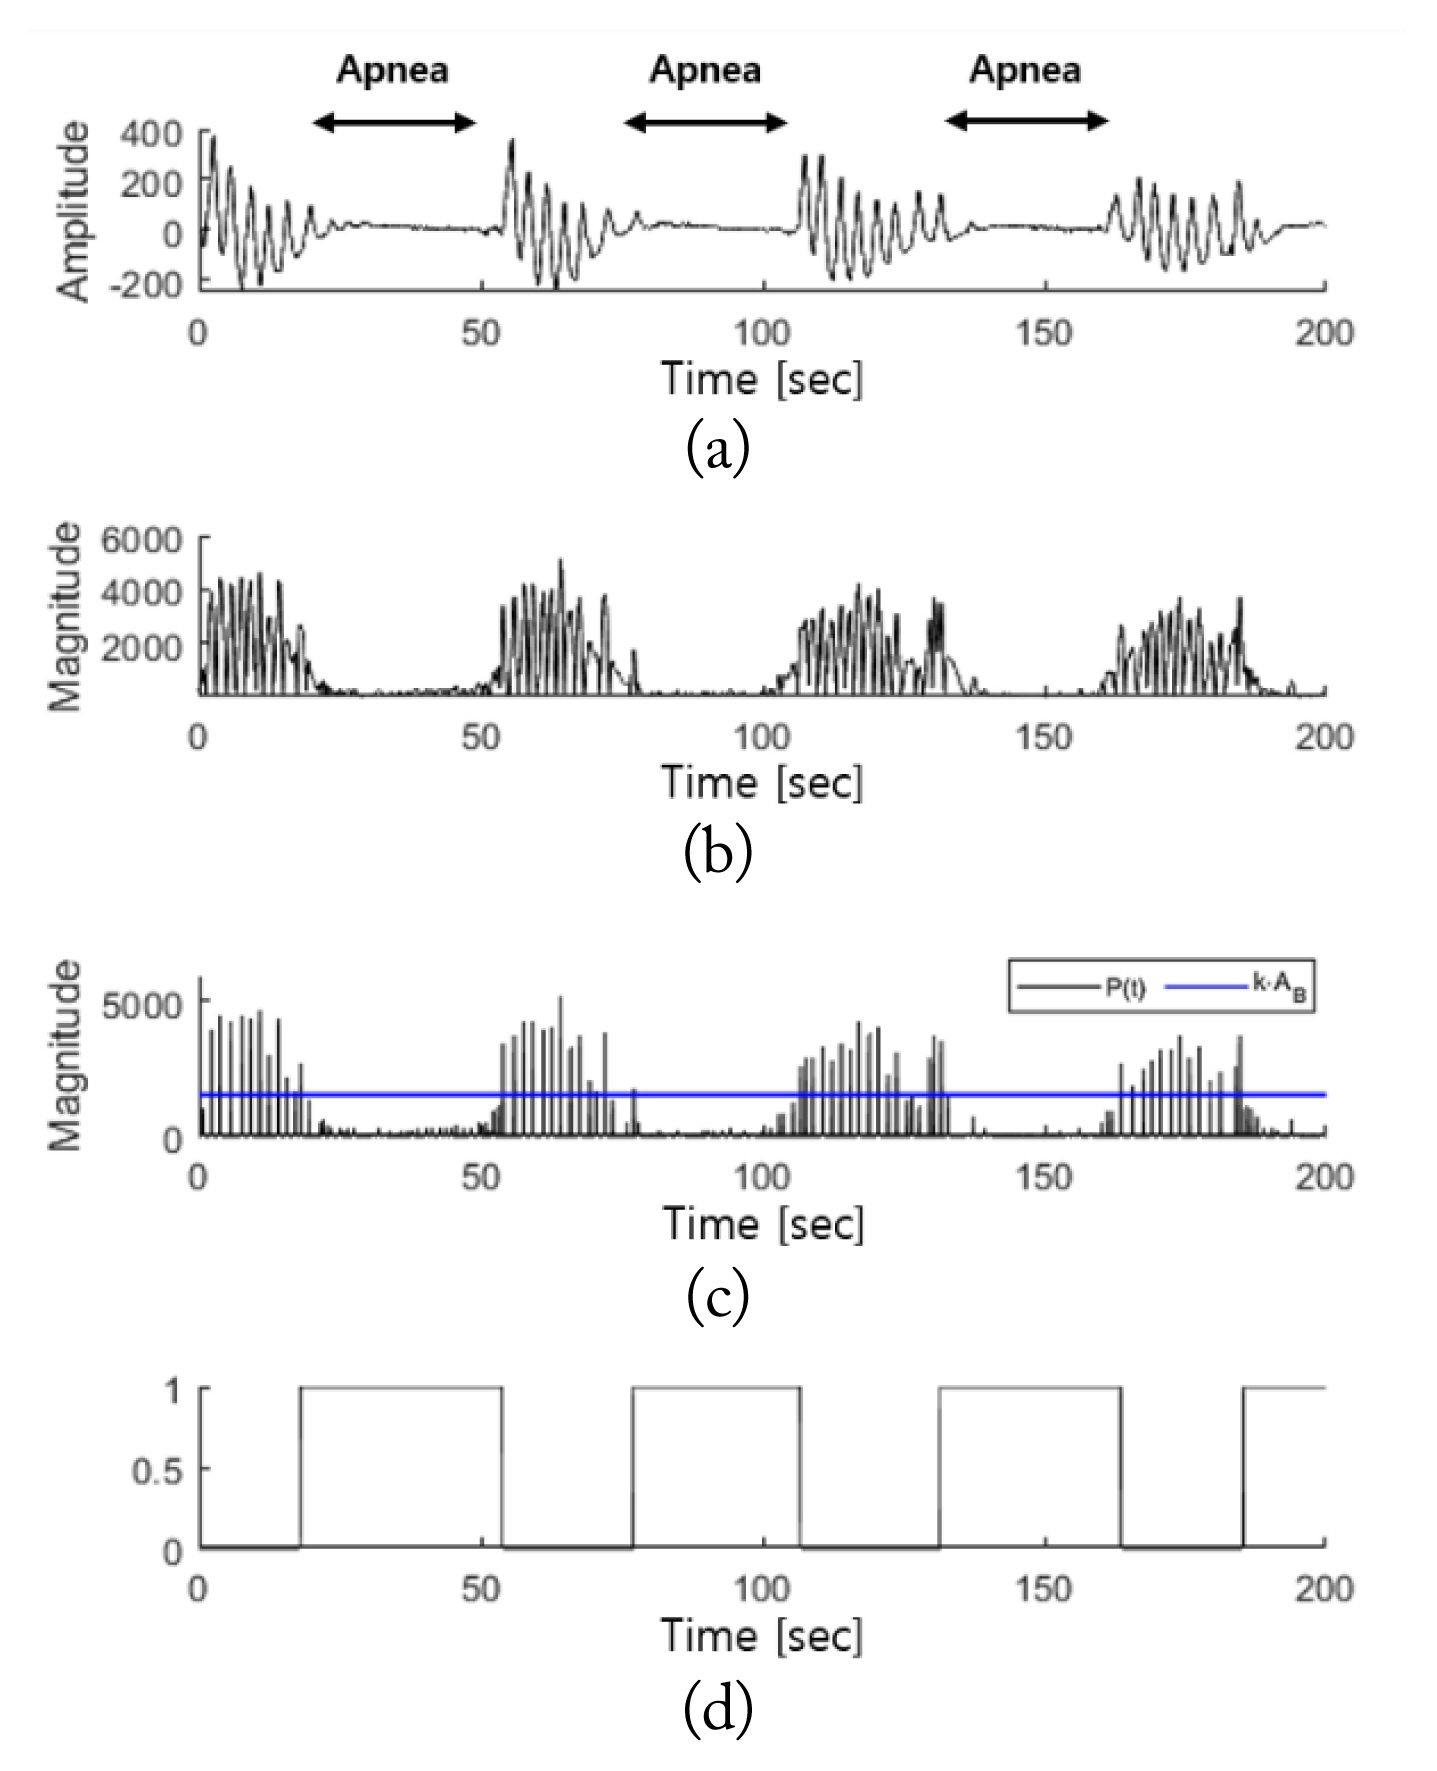
Fig. 8 shows the results of the breathing disorder detection interval in cases of apnea. Fig. 8(a) indicates that the amplitude of the respiratory signal sharply decreases compared to the normal breathing interval in apnea incidents, based on the observation of the PSG respiratory signals. Fig. 8(b) shows that this change in amplitude was equally detected in the radar signal, MŌĆ▓(t). When the breathing disorder interval was detected according to the proposed algorithm, the interval ultimately detected was ╬ĘŌĆ▓(t). As shown in Fig. 8(d), when comparing between ╬ĘŌĆ▓(t) and the PSG respiratory signals, there was close agreement on the apnea interval detected.
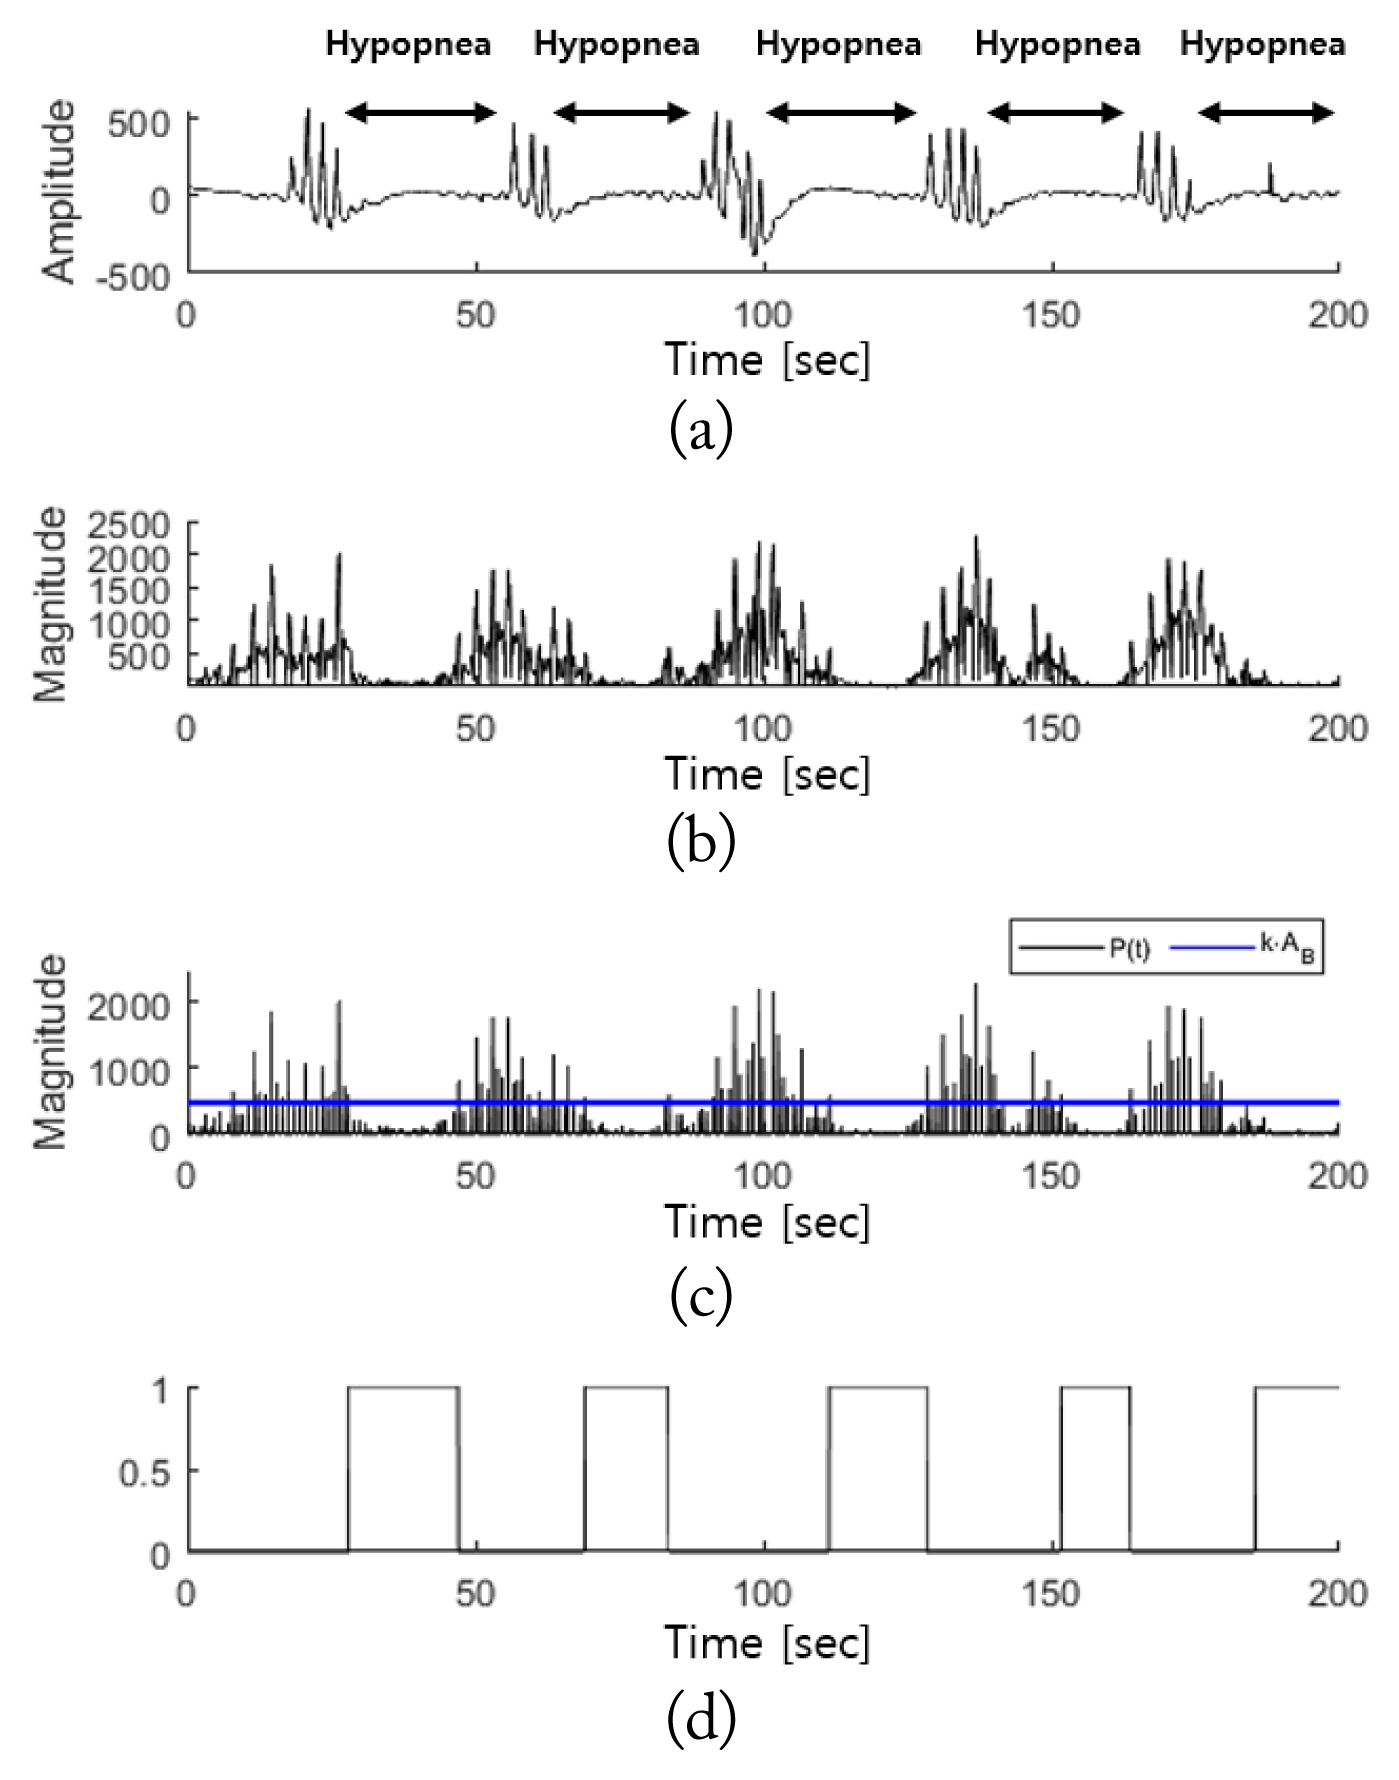
Fig. 9 shows the detection results for the breathing disorder interval in cases of hypopnea. In the case of hypopnea, similar to that of apnea, Fig. 9(a) indicates that the amplitude of the PSG respiratory signals sharply decreased. Fig. 9(b) shows that this reduction in amplitude was reflected in the radar signal, MŌĆ▓(t). The breathing disorder interval ultimately detected is shown in Fig. 9(d). There is, again, strong agreement between the PSG respiratory signals and the hypopnea detection interval.
The above results show that the proposed algorithm can be used to detect breathing disorder intervals in an appropriate manner in cases of apnea as well as hypopnea, as it successfully differentiates normal breathing from breathing disorders.
Among the 85 test subjects, 373 breathing disorder intervals with no movement and 97 normal breathing intervals were extracted. The performance of algorithm was measured by comparing the detection results after applying the proposed method to each interval with the actual PSG results. The comparison results are presented in the confusion matrix in Table 2. Based on the confusion matrix, the sensitivity, specificity, positive predictive value (PPV), and negative predictive value (NPV) were calculated.
Here, sensitivity refers to the probability with which the proposed algorithm accurately identifies an actual breathing disorder interval, while specificity refers to the probability with which the proposed algorithm identifies an actual normal breathing interval. Therefore, given the results listed in Table 3, there is a low probability that an actual normal breathing interval would be falsely detected as a breathing disorder interval when the proposed algorithm is applied, and the algorithm is approximately 77% accurate in detecting breathing disorder intervals.
IV. Conclusion
Non-contact breathing disorder detection can be used as an alternative to PSG for people suffering from breathing disorders during sleep because fewer sensors are required and measurements can be captured in a more comfortable environment, such as at home. To measure respiratory signals during sleep, this study utilized FMCW radar, which can be used conveniently in daily life owing to its low power consumption and small device. To more accurately extract respiratory signals, the range bin was selected by applying the MPC method after setting the target range based on the power of the breathing bandwidth signal. After determining the baseline with reference to the magnitudes of the respiratory signals extracted, the incidence intervals for apnea and hypopnea during sleep were detected through the reduction in the magnitude of the respiratory signals and the duration of the reduction period. Based on the experimental results, the detection of apnea and hypopnea intervals and extraction of respiratory signals using the proposed method produced results highly similar to those attained using PSG. As none of the proposed algorithms used machine learning, they have the advantage over studies using conventional machine learning techniques of providing a simple detection method with no need to create a pretraining model.
The limitations of this study are as follows. First, this study did not fully consider the movements of the test subjects during sleep. When test subjects move, the micro-displacement caused by breathing is hidden by the movement of the body, resulting in lower accuracy in the detection of breathing disorder intervals. Furthermore, the proposed algorithm can be used to detect respiratory event-related arousal. To accurately detect breathing disorders in test subjects in a sleep state, respiratory signals extracted in more diverse contexts must be analyzed, and new descriptors should be considered.