Development of a Numerical Tablet Model in WLAN Band for SAR Study
Article information
Abstract
This research proposes a numerical model for a tablet in the wireless local area network band for specific absorption rate (SAR) study. The design criteria, such as the tablet size, operating frequencies, antenna position, and target 1-g peak spatial-average SAR (psSAR) values in the flat phantom, are determined based on the SAR test reports of tablets distributed in South Korea from 2013 to 2017. An internal antenna is designed in a tablet platform to operate in dual bands of 2,450 MHz and 5,500 MHz. The numerical results illustrate that the 1-g psSAR values of the proposed numerical tablet model are within ±10% of the target values. Moreover, the return loss of the designed tablet model is larger than 10 dB, regardless of flat phantom, while its radiation efficiency is higher than 90% in free space.
I. Introduction
Since 2016, several SAR studies have proposed numerical models for mobile phones, including bar-type, folder-type, and smartphone-type mobile phones, in South Korea [1, 2]. Currently, tablets are widely used in wireless local area network (WLAN) services. The use of tablets, especially among infants, is common in many places, such as restaurants and vehicles, thus increasing the need for epidemiological research on tablets used in WLAN services. Therefore, proper evaluation and study of electromagnetic (EM) exposure should be conducted to scientifically judge the health effects of tablet use on humans, especially children.
In this study, for the first time, a numerical tablet model is developed for implementing numerical SAR studies. For this purpose, we analyze the specific absorption rate (SAR) test reports of tablet models distributed in South Korea from 2013 to 2017 to determine the tablet size, operating frequencies, antenna location, and target 1-g peak spatial-average SAR (psSAR) values on the flat phantom. We develop the numerical tablet model such that it satisfies the following conditions: the difference of the 1-g psSAR values (against the target 1-g psSAR values) is within ±10%, the |S11| is less than −10 dB, and the radiation efficiency is larger than 90%. The designed antenna operates in dual bands of 2,450 MHz and 5,500 MHz. All simulations are performed using Sim4life [3] based on the accurate and robust finite-difference time-domain (FDTD) method [4–7].
II. Numerical Tablet Modeling
In this study, we develop a simple numerical tablet model that does not include the complicated structures and materials of commercial tablets. Since the designed numerical tablet model will be employed for future SAR research based on the FDTD method, our simplified tablet modeling can significantly reduce the computational burdens of SAR simulations. As mentioned previously, we decide the design parameters, such as the tablet size, operating frequencies, antenna location, and target 1-g psSAR values on the flat phantom, based on the SAR test reports of commercial tablets released in South Korea in 2013–2017.
The detailed configuration of the numerical tablet model is presented in Fig. 1. The tablet size is set to 255 mm × 170 mm × 8 mm. The thicknesses of the tablet components are listed in Table 1, while their electrical properties, excerpted from [1], are listed in Table 2. Furthermore, Table 3 notes the two WLAN bands considered in this study and their respective SAR target frequencies. A survey of the SAR test reports reveals that most WLAN antennas are located at the top right side of tablets. Therefore, in the numerical tablet model, the WLAN antenna is designed to be located at the top right corner.
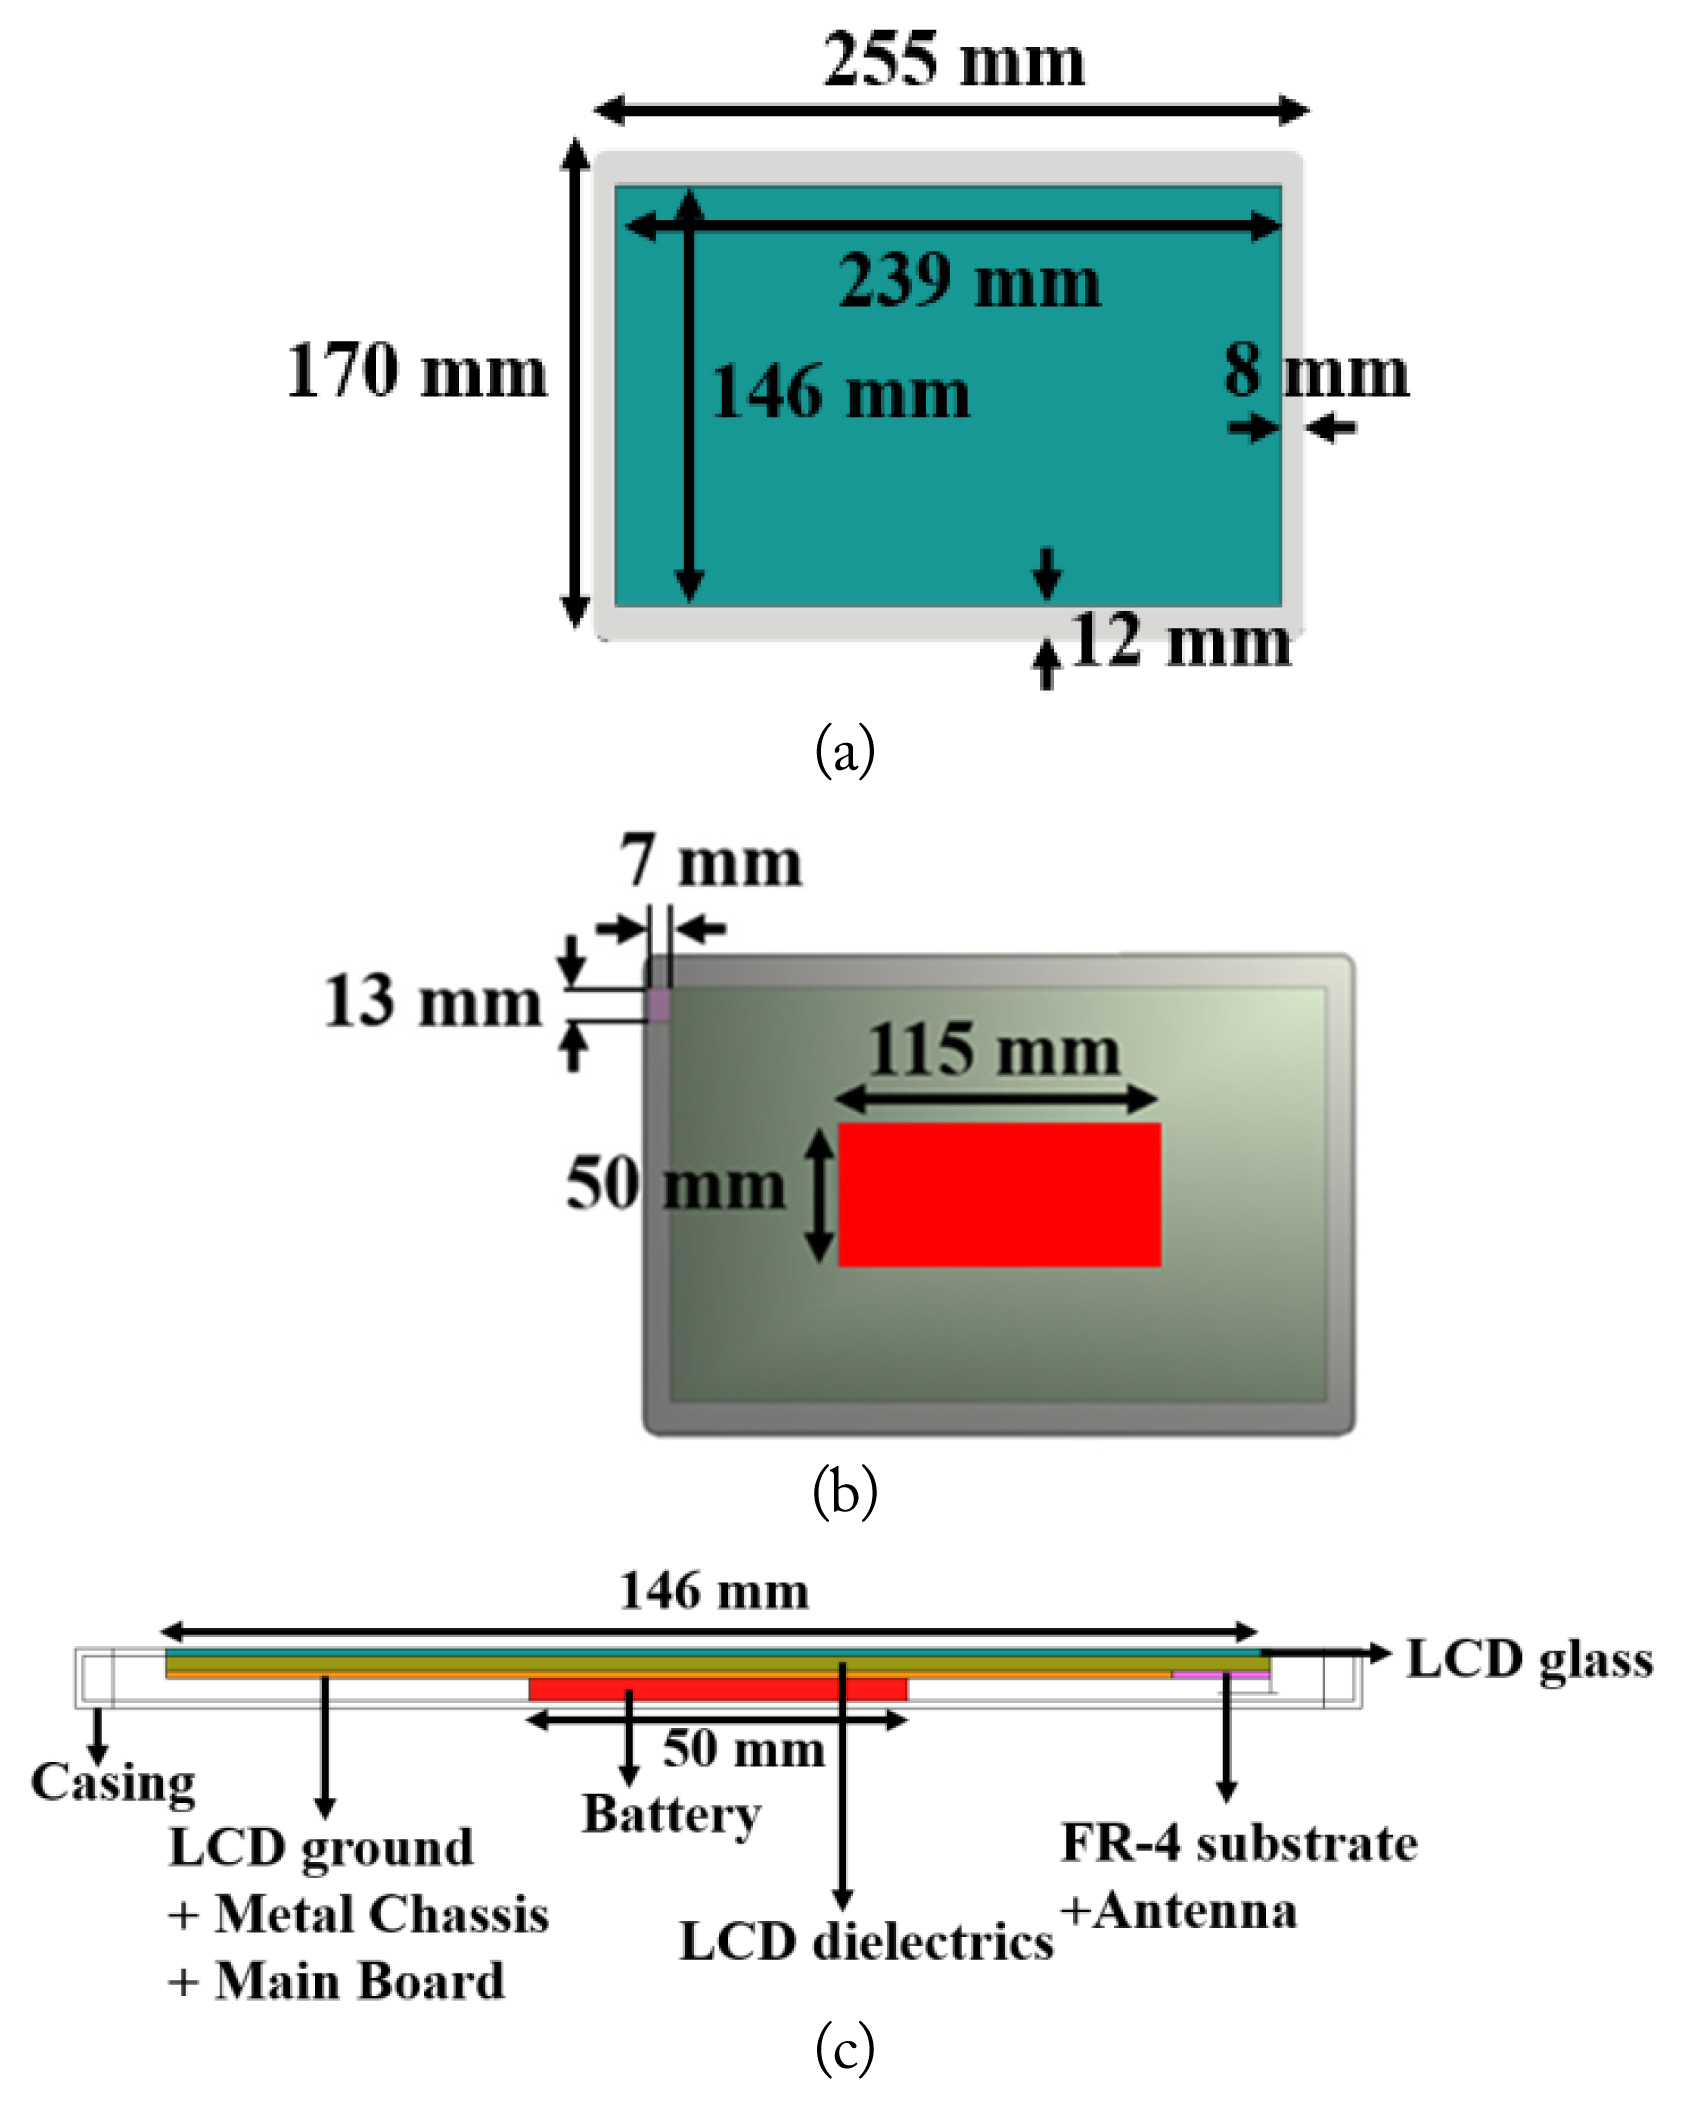
Schematic diagram of the numerical tablet model: (a) front view, (b) back view, and (c) side view.
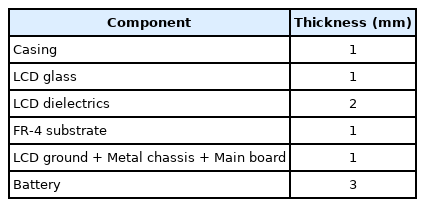
Thickness of tablet components

Electrical properties of tablet components

WLAN frequency band
According to the IEEE standard [8], it is necessary to consider all six planes of a hexahedron tablet device when performing SAR measurements using the flat phantom, as shown in Fig. 2. However, if the distance between the SAR measurement plane and the antenna is more than or equal to 2.5 cm, the corresponding SAR test can be excluded. Therefore, due to the distance between the measurement planes and the antenna location (top right side), only four planes (top, front, back, right) are considered.

SAR measurement planes.
In this study, the target 1-g psSAR values are determined by averaging all the measured 1-g psSAR values in the SAR test reports. Besides tablets with top right positioned antennas, we also consider tablets with antennas not located at the top right corner in this study in order to target the 1-g psSAR values. Toward this purpose, we assume that the antenna is located at the top right side, as shown in Fig. 3. For a tablet with the antenna located at the bottom left, as shown in Fig. 3(a), the 1-g psSAR value of the left (right) plane is considered to be that of the right (left), while the 1-g psSAR value of the top (bottom) plane is considered to be that of the bottom (top). Similarly, for Fig. 3(b) and 3(c), it is assumed that the antenna is located at the top right corner. Through this strategy, we can successfully average all the measured 1-g psSAR values of the SAR test reports. The target 1-g psSAR values at 2,450 MHz and 5,500 MHz are listed in Table 4. It should be noted that SAR evaluations for the bottom and left planes are excluded because the distance between the antenna and the SAR measurement planes is longer than 2.5 cm.
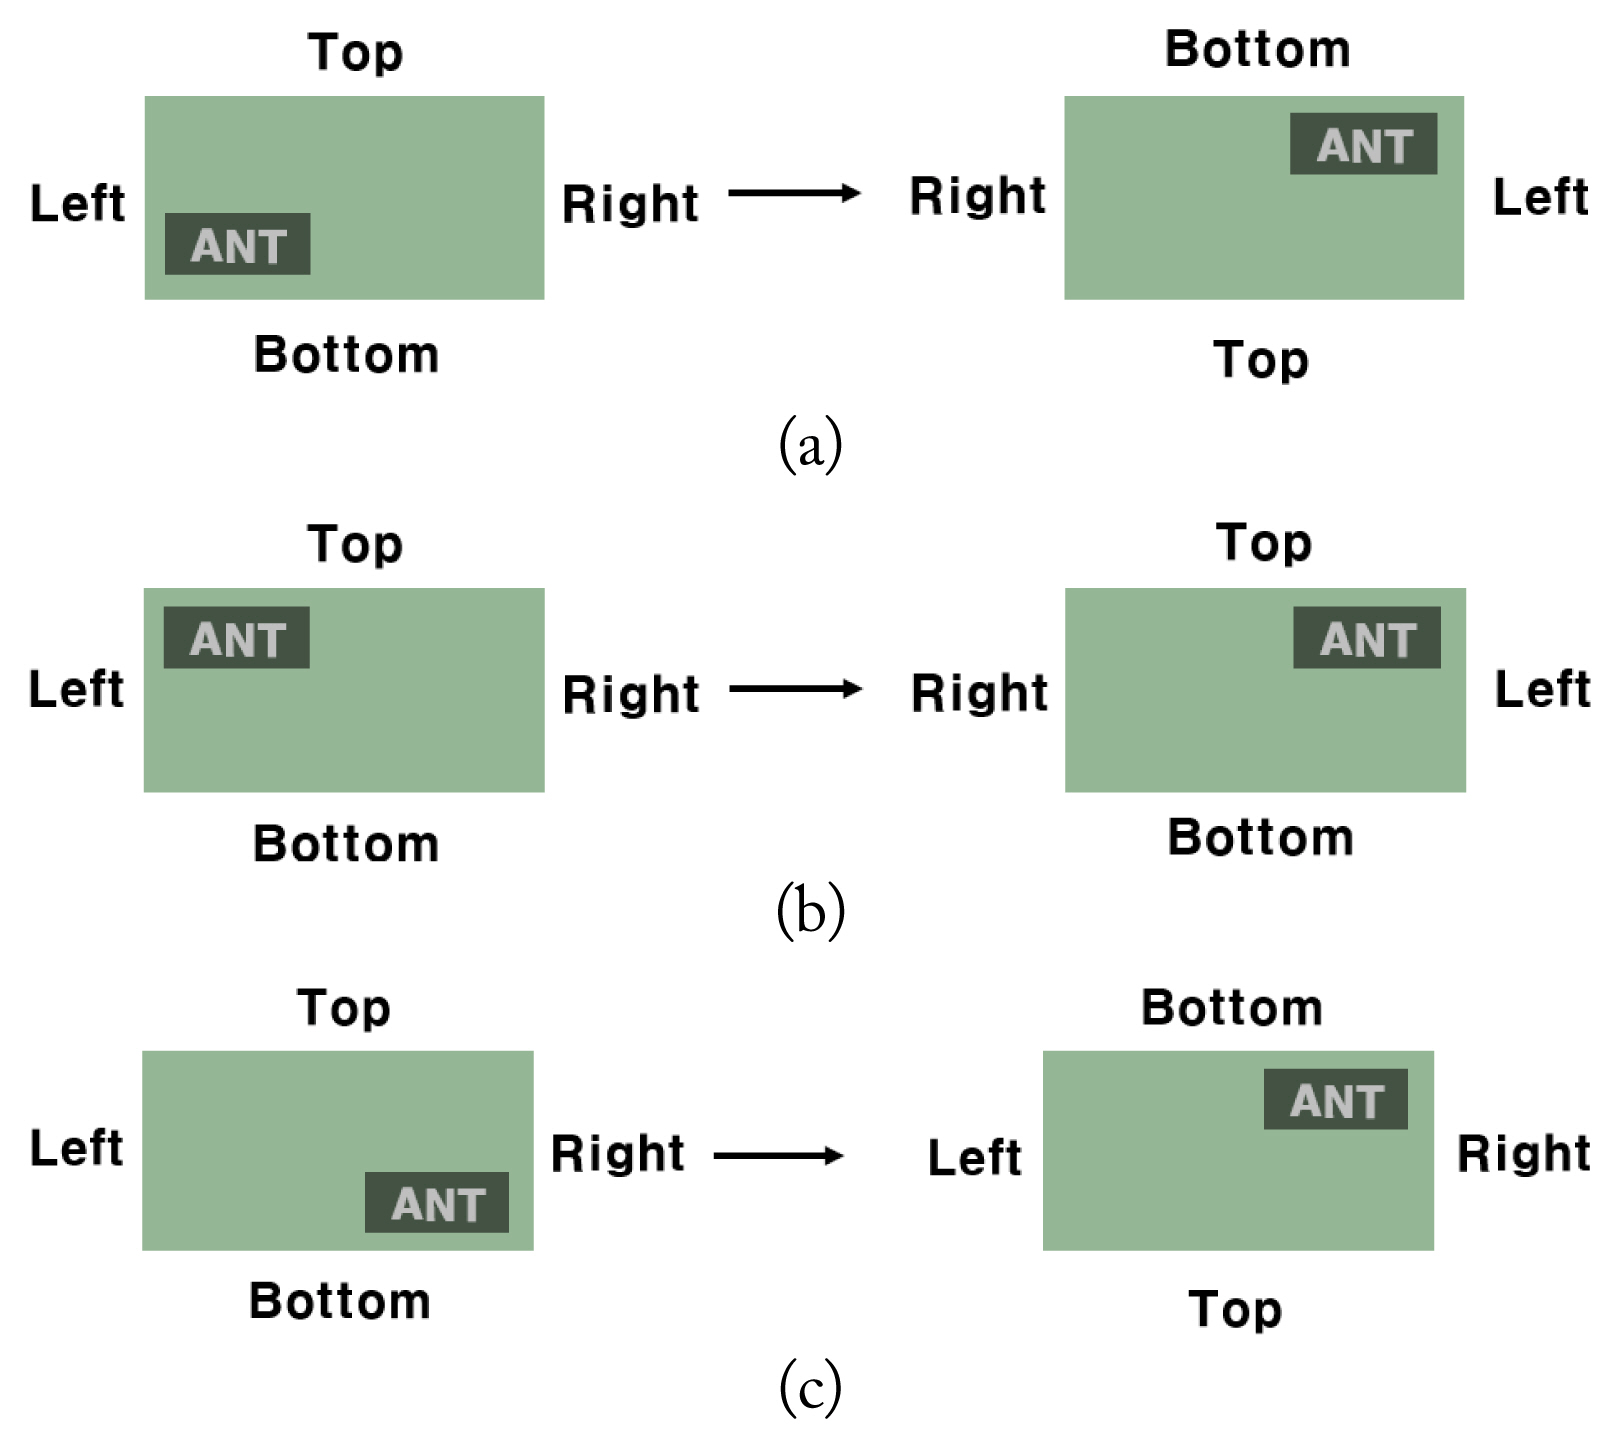
Equivalent tablet model with antenna position at the top right corner: (a) original antenna position (bottom left), (b) original antenna position (top left), and (c) original antenna position (bottom right).
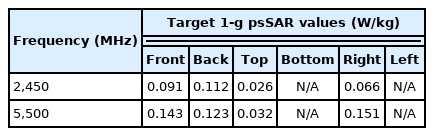
Target 1-g psSAR values
It is also of utmost importance to develop a numerical tablet model that yields good antenna performance while simultaneously satisfying the target 1-g psSAR values with small differences. Fig. 4 presents the design guidelines for the model, as also listed below:
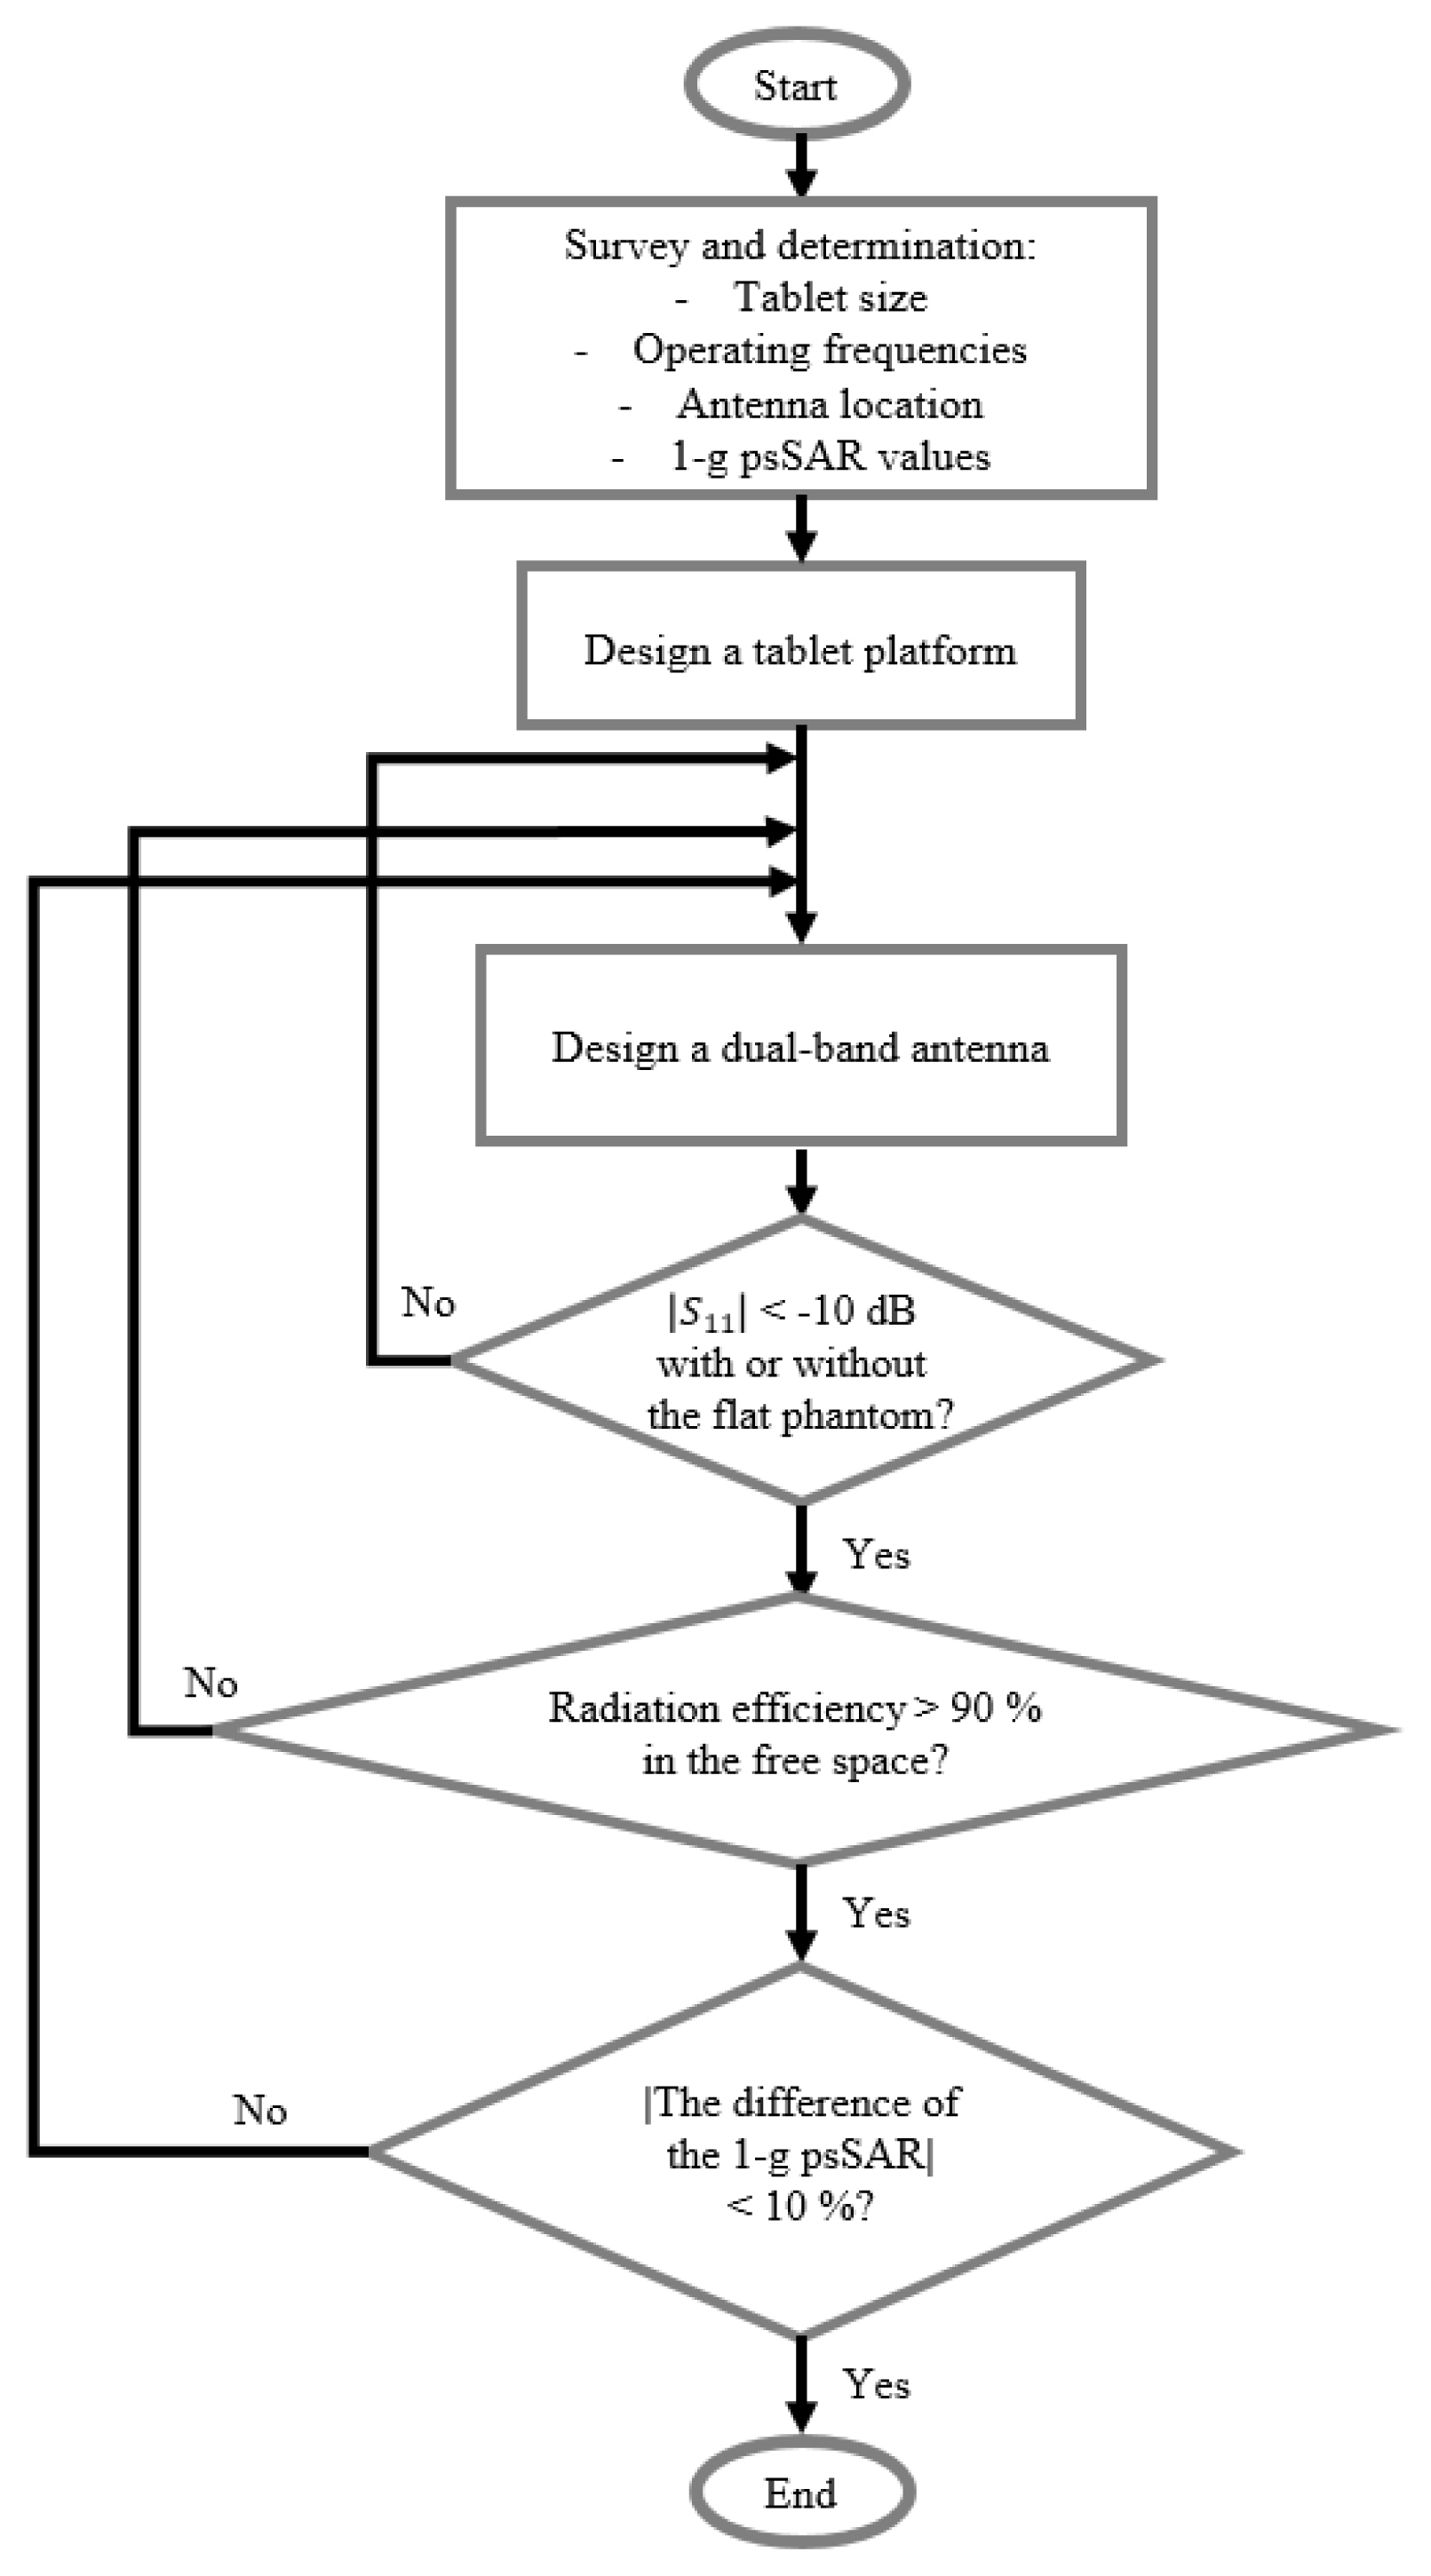
Design flowchart for the numerical tablet model.
(1) The magnitude of S11 should be less than −10 dB, irrespective of the existence of a flat phantom.
(2) The radiation efficiency should be higher than 90% in free space.
(3) The difference between the 1-g psSAR value and the target value should be within ±10%.
Before proceeding with the antenna design, the issue of the flat phantom, referred to in the IEEE standard [8], should be addressed. The flat phantom is composed of a liquid and a shell. The liquid takes the shape of a rectangular parallelepiped with a width of 355 mm, length of 270 mm, and thickness of 180 mm. Notably, the bottom of the liquid is covered by a 2-mm thick shell, whose relative permittivity is 3.7. The electrical properties of the liquid are listed in Table 5. The tablet is positioned 10 mm away from the liquid in the flat phantom in all FDTD SAR evaluations.
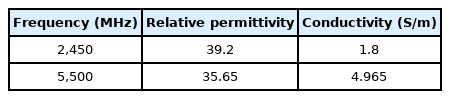
Electrical properties of the liquid
The inverted-F antenna [9, 10] is employed in the numerical tablet model. In this study, the antenna is designed to operate in dual bands (2.4 GHz and 5 GHz bands). After extensive FDTD simulations, we designed a dual-band antenna that satisfies the above-mentioned design criteria. The antenna configuration is presented in Fig. 5, and the antenna parameters are listed in Table 6.
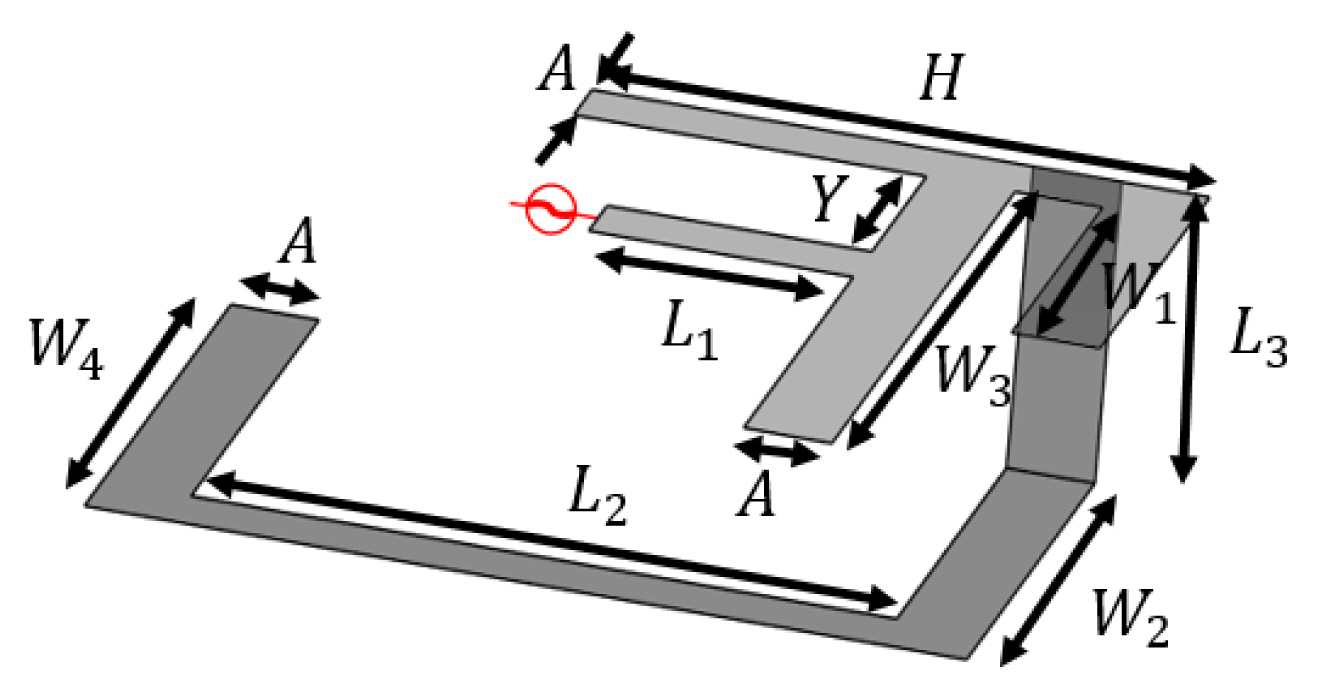
Antenna configuration.

Antenna parameters
III. Numerical Results
This section provides the FDTD simulation results of the designed numerical tablet model. The reflection coefficient and radiation efficiency are depicted in Figs. 6 and 7. Fig. 6 shows that |S11| is less than −10 dB for the numerical tablet model, irrespective of the presence of a flat phantom in both WLAN bands. Fig. 7 illustrates that the radiation efficiency of the numerical tablet model in free space is higher than 90%. It is also observed that the loss of the flat phantom reduces radiation efficiency. The simulated 1-g psSAR values and their target values for the target frequency of 2,450 MHz are listed in Table 7, while Table 8 notes the same for the 5,500 MHz frequency band. The maximum difference between the target values and result values is −9.93%. Overall, it is observed that the numerical tablet model developed in this study satisfies all design criteria.
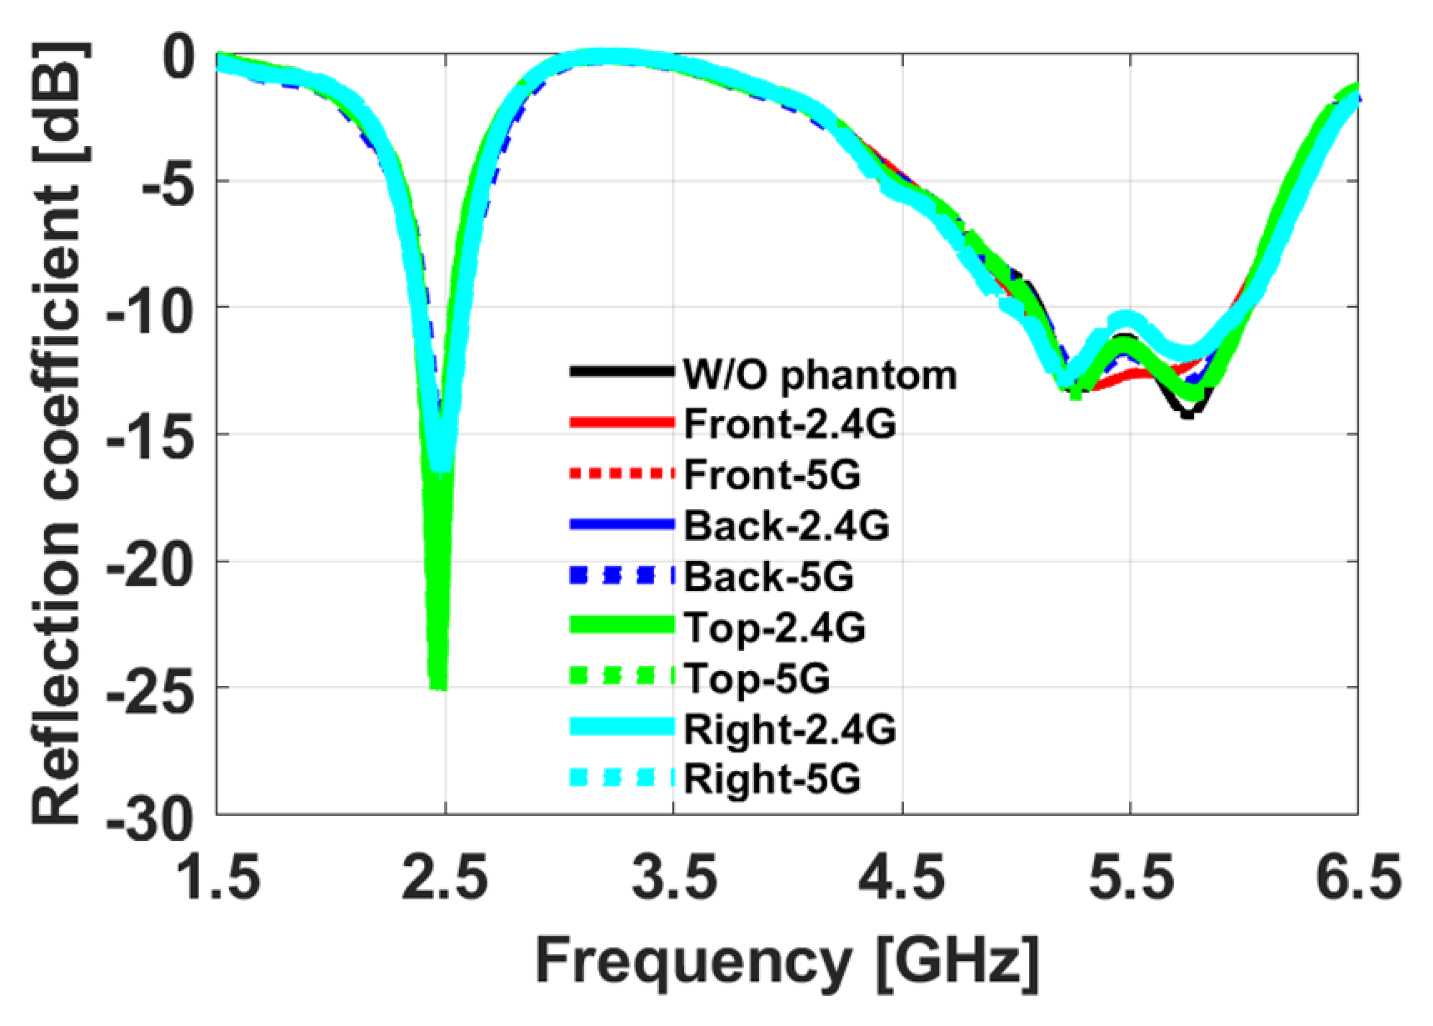
Reflection coefficient.
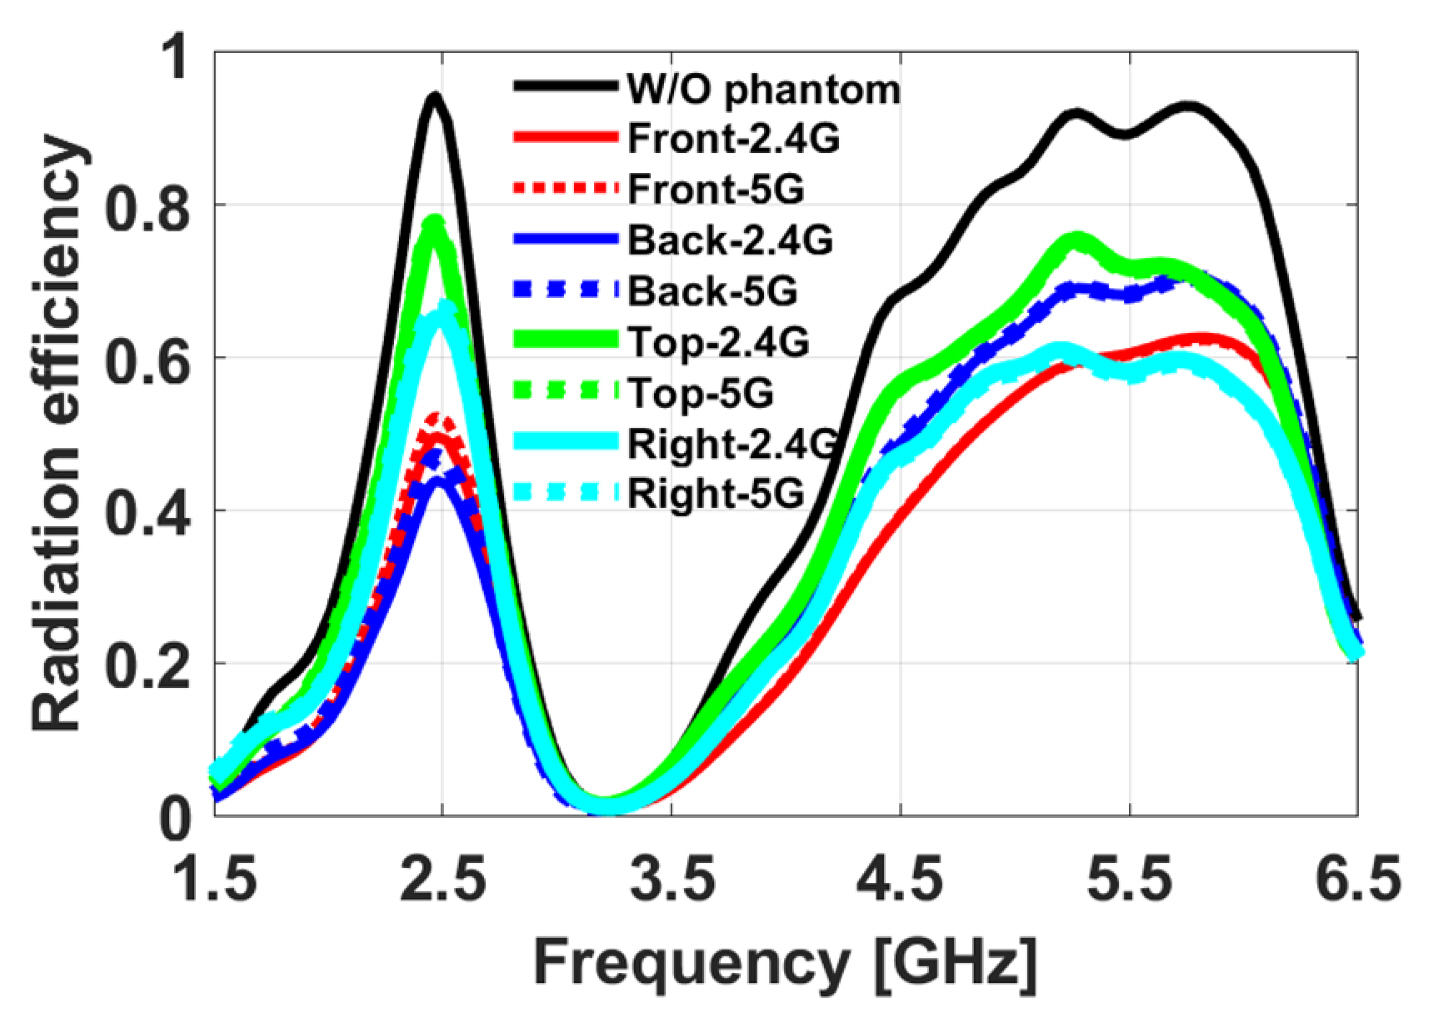
Radiation efficiency.
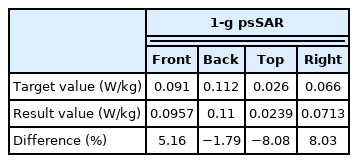
Target and simulated 1-g psSAR values at the 2,450 MHz target frequency

Target and simulated 1-g psSAR values at the 5,500 MHz target frequency
IV. Concluding Remarks
The widespread use of tablets necessitates the development of a numerical tablet model for SAR study. In this work, we present a numerical tablet model composed of a tablet platform and a dual-band antenna in the WLAN band. The design parameters of the numerical tablet model, including its size, operating frequencies, and antenna location, are determined by investigating the SAR test reports of tablets released in South Korea in 2013–2017. Drawing on this data, we developed a numerical tablet model that satisfies crucial design guidelines, such as antenna performance and 1-g psSAR values on a flat phantom. Numerical simulations conducted in this study demonstrate that (1) the return loss of the numerical tablet model is larger than 10 dB, regardless of the existence of flat phantom, (2) the radiation efficiency of the numerical tablet model in free space is higher than 90%, and (3) the maximum difference between the simulated 1-g psSAR values and the target values is −9.93%. Our well-designed numerical tablet model can be applied for on-going epidemiological studies on the use of tablets.
Acknowledgments
This work was supported in part by the ICT R&D program of MSIT/IITP (No. 2019-0-00102, A Study on Public Health and Safety in a Complex EMF Environment) and in part by the National Research Foundation of Korea (NRF) grant funded by the Korea government (MSIT) (No. 2020 R1F1A1055444). The authors would like to thank Samsung Electronics for allowing the use of their SAR test reports.
References
Biography

Jisu Lee received her B.S. degree in Electronic Engineering from Seokyeong University, Seoul, Republic of Korea, in 2019. She is currently pursuing her Ph.D. in Electronic Engineering at Hanyang University, Seoul, Republic of South Korea. Her current research interests include antenna development.

Ae-Kyoung Lee received her B.S. and M.S. degrees in Electronic Engineering from Chungang University, Seoul, Republic of Korea, in 1990 and 1992, respectively. She received her Ph.D. in Radio Science and Engineering from Chungnam National University, Daejeon, Republic of South Korea, in 2003. In 1992, she joined the Radio Technology Group at the Electronics and Telecommunications Research Institute, Daejeon, Republic of Korea, where she is currently a principal researcher and has been involved in projects on measurement technologies and numerical analyses of electromagnetic compatibility and human exposure to RF fields. She was the recipient of the Japan Microwave Prize at the 1998 Asia-Pacific Microwave Conference, Japan, and the Technology Award from the Korean Institute of Electromagnetic Engineering and Science in 1999.

Seon-Eui Hong received her M.S. and Ph.D. degrees in Radio Science and Engineering from Chungnam National University, Daejeon, Republic of Korea, in 1999 and 2017, respectively. Since 1999, she has been working with the Electronics and Telecommunications Research Institute, Daejeon, Republic of Korea, and is currently a principal member of the radio environment and monitoring research group. Her current research interests include numerical dosimetry and procedures for assessing electromagnetic sources.

Hyung-Do Choi received his M.S. and Ph.D. degrees in Material Science from Korea University, Seoul, Republic of Korea, in 1989 and 1996, respectively. Since 1997, he has been working with the Electronics and Telecommunications Research Institute, Republic of Korea, as a principal researcher at the Radio and Satellite Research Division. He has performed research on the biological effects of RF radiation and has developed RF radiation protection standards and regulations. His current research interests include spectrum management, microwave tomography, and EMC countermeasures. He has also received a Technology Award from the Korean Institute of Electromagnetic Engineering and Science.

Kyung-Young Jung received his B.S. and M.S. degrees in Electrical Engineering from Hanyang University, Seoul, Republic of Korea, in 1996 and 1998, respectively. He received his Ph.D. in Electrical and Computer Engineering from Ohio State University, Columbus, USA, in 2008. From 2008 to 2009, he was a postdoctoral researcher at Ohio State University. From 2009 to 2010, he was an assistant professor in the Department of Electrical and Computer Engineering, Ajou University, Suwon, Republic of Korea. Since 2011, he has worked at Hanyang University, where he is currently a professor in the Department of Electronic Engineering. His current research interests include computational electromagnetics, bioelectromagnetics, and nanoelectromagnetics. Dr. Jung received a Graduate Study Abroad Scholarship from the National Research Foundation of Korea, a Presidential Fellowship from Ohio State University, an HYU Distinguished Teaching Professor Award from Hanyang University, and an Outstanding Research Award from the Korean Institute of Electromagnetic Engineering and Science.