Significant Reduction of Resonant Frequency by Multi-Layered Dielectric Material-Loaded Coaxial Cavity for Microwave Heating
Article information
Abstract
This paper presents a microwave heating method using a cavity whose size is much smaller than the free-space wavelength. The resonant frequency was reduced by inserting multi-layer dielectrics into the cavity, and an appropriate mode was generated in the cavity to heat a specific area inside it. High-permittivity dielectrics were used to make the cavity resonate in the frequency range of a few gigahertz. A formula for the resonant frequency of the multi-layer dielectric material-loaded cylindrical cavity was analytically derived. The frequency reduction by using a dielectric-loaded cylindrical cavity geometry was predicted from the derived formula, from 12.2 GHz to 4.6 GHz, whereas the experiment results showed a reduction from 10.8 GHz to 4.5 GHz. The analytical and the experiment results were compared and analyzed with simulations, which showed good agreement. The heating efficiency at the target in the multi-layered dielectric geometry was analyzed. The electric field inside the target material was measured to prove the temperature response of the microwave heating and was compared with the simulation result. This paper confirms a technical possibility of microwave heating of a smaller-sized cavity with an insertion of low-loss dielectric material in the vicinity of a heating target.
I. Introduction
Microwave dielectric heating is known to be useful because of its merits, such as local, its instant, and efficient heating compared with traditional heating methods [1–5]. The traditional method heats a material gradually from its surface, which delays the temperature rise. In contrast, microwaves can pass through the vessel and heat a target directly, causing an immediate temperature rise [5–9]. Heating a target in a small container less than 1–2 cm is challenging because the microwave source becomes expensive and bulky for the container resonant frequency, which becomes greater than 10 GHz. The goal of this study is to reduce the cavity resonant frequency to less than 10 GHz so that the microwave source is available at a reasonable expense and size without increasing the container size. We propose to insert a high-permittivity background material into the cavity to reduce the container resonant frequency and to apply an appropriate mode to concentrate the electric field on the target material. In this paper, we present a new analytical formula for a cylindrical cavity loaded with multiple dielectric materials and compare the result with a simulation and an experiment using a vector network analyzer (VNA).
II. Analytical Formula for Resonant Frequency
The resonant frequency is determined by the geometry of the cavity, permittivity, and permeability of the dielectric material inside the cavity. It can be expressed as Eq. (1):
where a is radius, d is height, c denotes the speed of light, k signifies the wave number, l is the integer number, and pnm is the mth root of Jn(x), the Bessel function of the first kind with order n. We assume that the relative permeability of dielectrics is 1. When more than two dielectric materials are loaded in the cavity, the formula should be modified according to the shape and the location of the dielectric materials. In Fig. 1(a), a double-layer dielectric material is inserted in the form of a cylinder, with radii a and b, corresponding to the target and the background material radii.
(a) Diagram of target and background materials in a cylindrical cavity. (b) Simulation model of the cavity. (c) Fabricated cavity and backside of a cover. (d) All-background alumina sample.
When l is equal to zero, wave equations can be expressed as follows [10]:
where ɛt and ɛb denote the permittivity of the target and the background materials, and k0, kb, and kt represent the wave numbers for the free space, the background material, and the target material, respectively. The solutions of Eqs. (2) and (3) are
For the TM010 mode, ez and hφ should be continuous at ρ = α, and ez should be zero at ρ = b. With these boundary conditions and from Eq. (4)k0 can be calculated by satisfying Eq. (5):
Jm(x) is the Bessel function of the first kind with order m, and p01 is the first solution of J0(x). The formula for the resonant frequency of the dielectric material-loaded cavity is Eq. (6), with k0 satisfying Eq. (5):
III. Design of the Cavity and Experimental Setup
The cavity under study is shown in Fig. 1(b). The cavity is filled with a target material and a background material, and the cover has a hole for inserting the target material. To study the resonant frequency change with the insertion of dielectric materials, two cases are considered. When the target and the background materials are of the same kind, this is the case of a one-layer sample. A double-layer sample is considered in case the target and the background materials are of different kinds. Both the cavity diameter and the height are fixed at 19 mm. Fig. 1(c) and 1(d) show photos of the fabricated cavity and an alumina sample, respectively. The dielectric permittivity of the alumina sample is 9.7, and the loss tangent is 0.0001. A VNA (N5247A; Keysight Technologies, Santa Rosa, CA, USA) is used in the experiment.
IV. Simulation and Experiment Results
Fig. 2(a) shows the reflection coefficients of the simulation and the experiment with the unloaded cavity to check its resonant frequency. The simulation was performed by using CST Microwave Studio 2020 [11]. The resonant frequency was around 11 GHz in the simulation with the TM010 mode, and it was 10.86 GHz in the experiment. The resonant frequencies were shifted to lower values when both the one-layer and the double-layer alumina samples were loaded in the cavity, as shown in Fig. 2(b) and 2(c). The target material in Fig. 2(c) was set as air so that it had the lowest permittivity to analyze a basic case of the frequency shift. Table 1 shows the detailed results regarding the frequency shift.
S11 measurement results by VNA: (a) the cavity is not loaded with any dielectric material, (b) the cavity is loaded with alumina as both target and background materials (one-layer), and (c) the cavity is loaded with alumina as the background material and air as the target material (double layer).
Resonant frequencies of unloaded, one-layer, and double-layer cases
The field pattern of the cavity is shown in Fig. 3. In Fig. 3(a) and 3(b), the cavity is one layer filled by alumina, and the resonant frequency is 3.66 GHz, the same as the peak in Fig. 2(b). Despite the field distortion because of the cover of the cavity and the probe, TM010 is obviously the main mode. Fig. 3(c) and 3(d) show the case of the double layer with a frequency of 4.26 GHz.
(a, b) E-field and H-field patterns of TM010 in the one-layer case. (c, d) E-field and H-field patterns of TM010 in the double-layer case.
According to the derived formula, the resonant frequencies of the one-layer and the double-layer cavities were lowered by more than a factor of 2 compared with the unloaded cavity with the resonant frequency of 12.2 GHz. The analytical resonant frequency results were slightly higher than the simulation results because the simulation setup considered a probe and an insulator existing in the wall of the cavity, whereas these elements were not taken into account in the analytical formula. In fact, when the all-background loaded cavity was simulated in the eigenmode simulation without any parts, such as a probe and an insulator, its resonant frequency was around 3.92 GHz, which would explain the frequency mismatch between the analytical and the simulation results [12, 13].
The discrepancy between the simulation and the experiment results is caused by the air gap between the cover and the fabricated alumina sample; a 0.17-mm air gap exists between the cover and the fabricated sample, whereas the simulation model has no air gap. Fig. 4(a) shows the possible air gaps between the cavity and the fabricated sample. Fig. 4(b) and 4(c) show the simulation results according to the air gaps. The imperfection of the geometry and the relative permittivity of the alumina contribute to the difference.
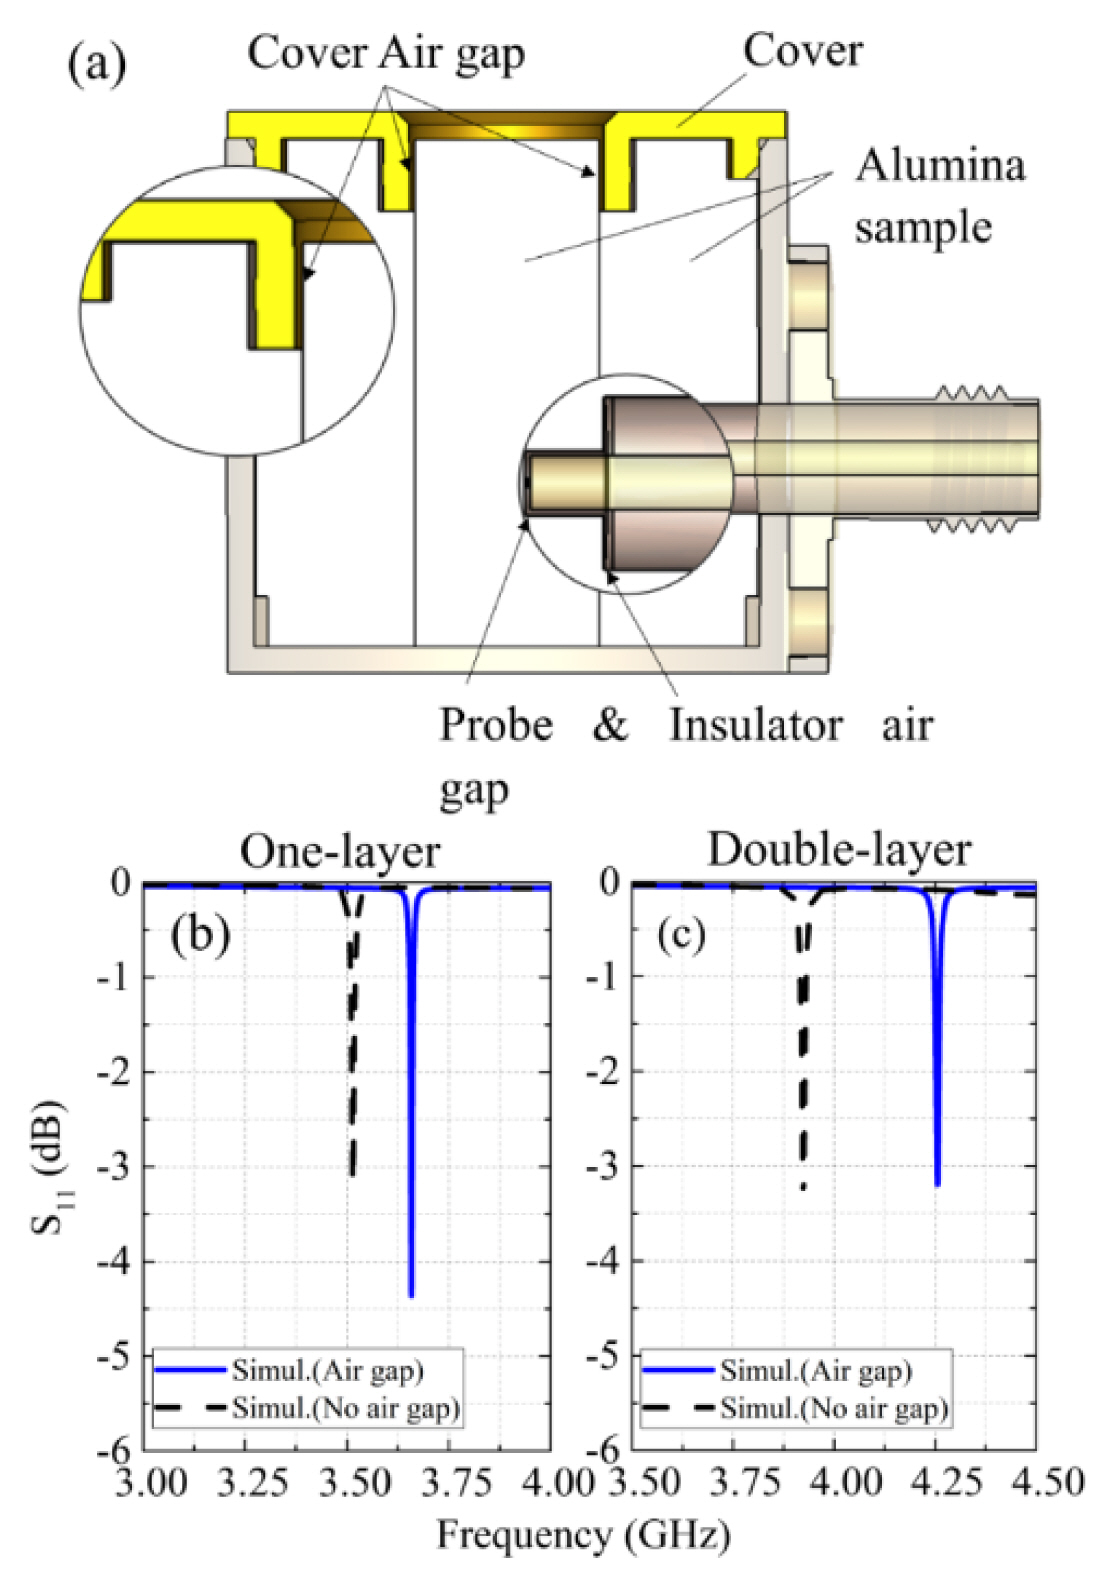
(a) The air gap between the cover and the fabricated alumina sample. (b, c) The simulation results of the frequency shifting as reflecting the air gap in the one-layer and the double-layer cases.
V. Microwave Heating Analysis
Fig. 5(a) compares the heating power in the target under two conditions: the presence and the absence of the background material. We assume that the incident power is 1 W and perfectly matched between the cavity and the cable so that the reflection on the cable is not taken into account. The relative permittivity (K) and the loss tangent (tanδt) of the target are fixed at 9.7 and 0.02, respectively. We observe a similar level of power absorption of the target, with a significant reduction of the alumina background is inserted. The resonant frequency is decreased by 67%, while the heating efficiency maintains a similar level. The target heating efficiency is 94% with the alumina background and 93% with no background. Fig. 5(b) shows the difference of the heating power in the target and the background when the relative permittivity and the loss tangent of the target are varied. As expected, the power in the target is much higher than in the background, whose heating power is negligibly small (around 3–18 mW). As shown in Fig. 5(c), we consider the impedance of the cavity and the cable so that the target heating efficiency varies from 50% to 96% (at K = 9.7), with an increasing loss tangent of the target up to 0.01. A steady-state heating analysis by simulation is performed, as shown in Fig. 5(d), where the temperature in the target is extracted at the maximum value and plotted with input power, with fixed permittivity and loss tangent of the target (SiO2) at 3.8 and 0.003, respectively, and the injected power is varied from 0.5 W to 125 W at 3.89 GHz. The heating efficiency is 47.3% in the target versus 11.6% in the background, when the input power is set at 125 W. The target absorbs most of the power, as shown in Fig. 5(e), because the electric field is concentrated on the target. The target also has a high loss tangent compared with that of the background so that the cavity shows a similar performance in microwave heating and traditional heating although the size of the cavity is considerably reduced [14–17].
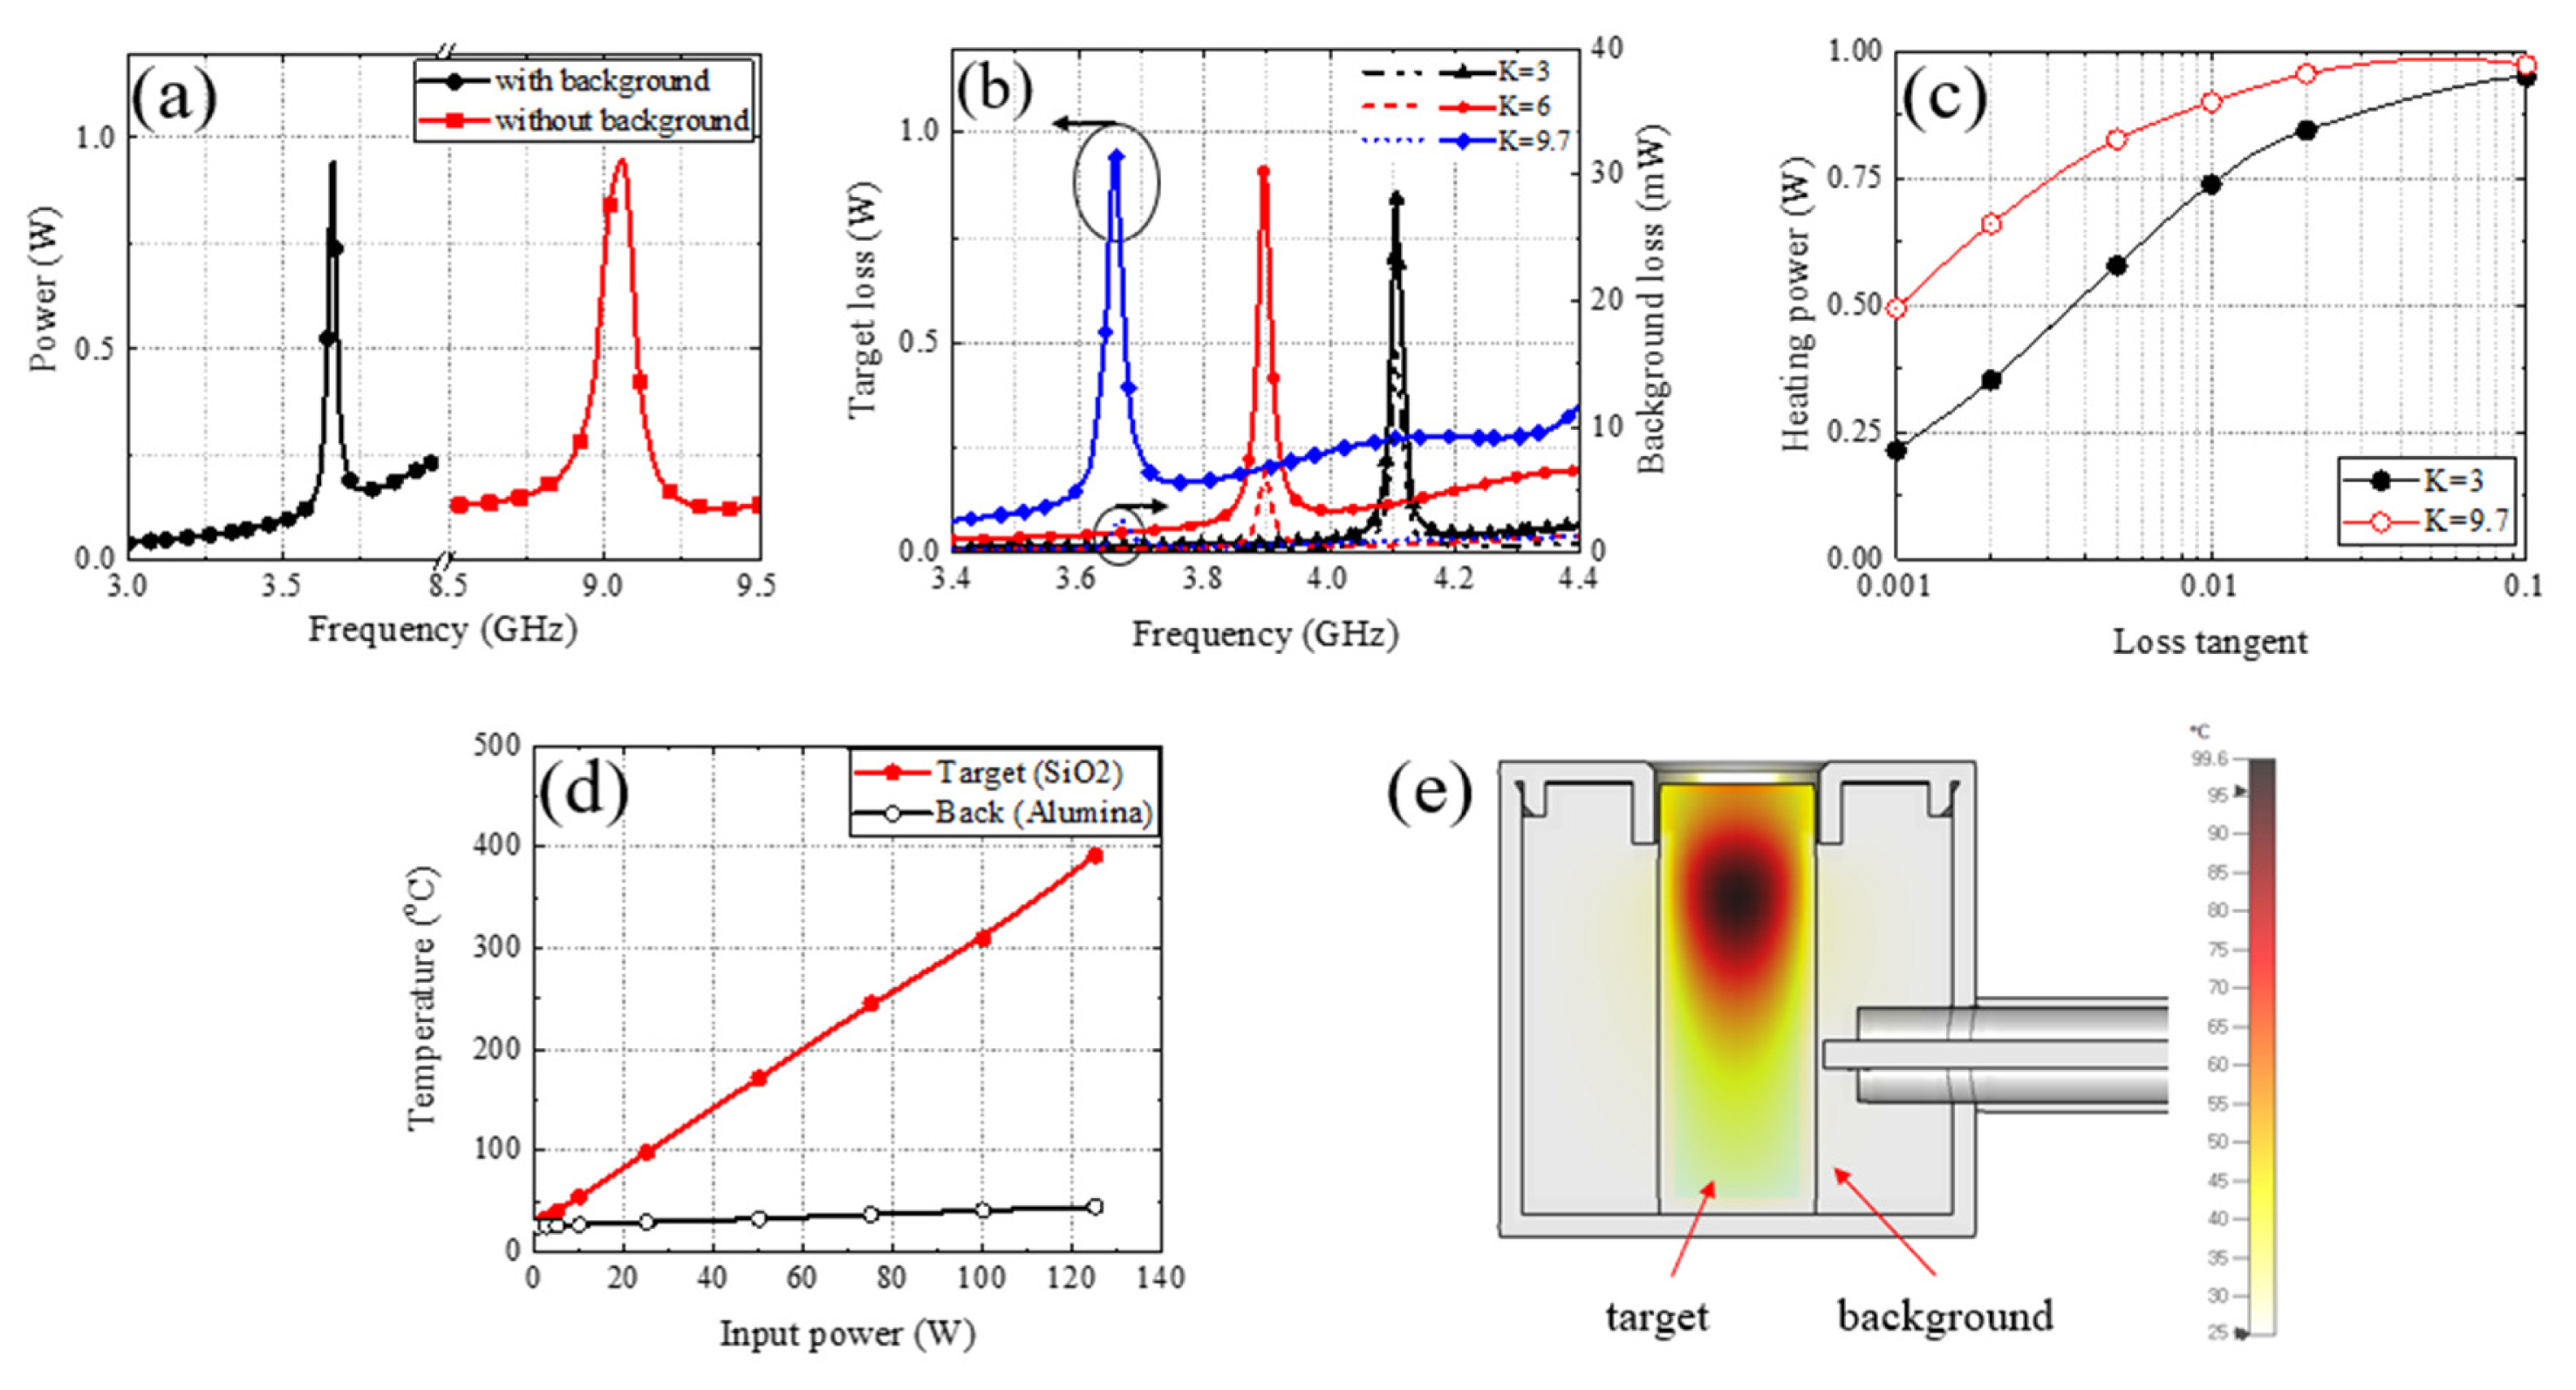
(a) Power comparison with and without a background. (b) Difference of heating power between the target (symbol) and the background (dash) according to the relative permittivity, K, of the target. (c) Heating power of the target as a function of the loss tangent of the target when alumina background is loaded in the cavity with considering impedance of the cavity and the cable. (d) A steady state heating analysis result in simulation with target as SiO2, background as alumina. (e) Temperature distribution pattern of the target and background at input power 25 W.
To prove that the temperature rise is due to the electric field concentrated on the center of the target, we experimentally measure the electric field inside the target material by using a coaxial probe and a VNA [18]. Fig. 6 shows the coaxial voltage detecting probe, which measures electric fields inside the cavity, and Fig. 7 illustrates the schematic setup for the electric field measurement. The probe is inserted into the cavity and measures the relative electric field intensity at the tip of the probe with −5 dBm input power from the VNA. We measure the transmission coefficient and convert it to the electric field. However, as the probe is inserted, the field inside the cavity is distorted. Therefore, to predict the distortion, we perform a simulation with a coaxial probe inserted into the cavity under the same conditions as those used in the experiment. We compare the electric field intensity and the temperature of the target material, as shown in Fig. 8. The red and the blue lines are the simulation and the experiment results, respectively, for the electric fields inside the cavity as a function of the depth (Fig. 8). The top and the bottom of the cavity measure 0 mm and 20 mm, respectively. The black line shows the temperature profile at the center of the target material, according to the depth when an injected input power is set at 25 W. The electric field intensity is measured at the end of the output port of a coaxial detector as the decibel scale. In the simulation, the temperature profile follows the electric field intensity profile with the maximum value at 5-mm depth from the top of the cavity. The experiment result shows a good agreement with the simulation, except for some shift of the maximum field depth location. We guess that it is because the probe comes out of the cavity in the 0–5-mm range, which causes the interference with the external environment. Moreover, the target material is in powder form, which causes the distortion of the target when the probe is inserted. Therefore, the density of the target is decreased, and the distorted part cannot resonate with the operating frequency.
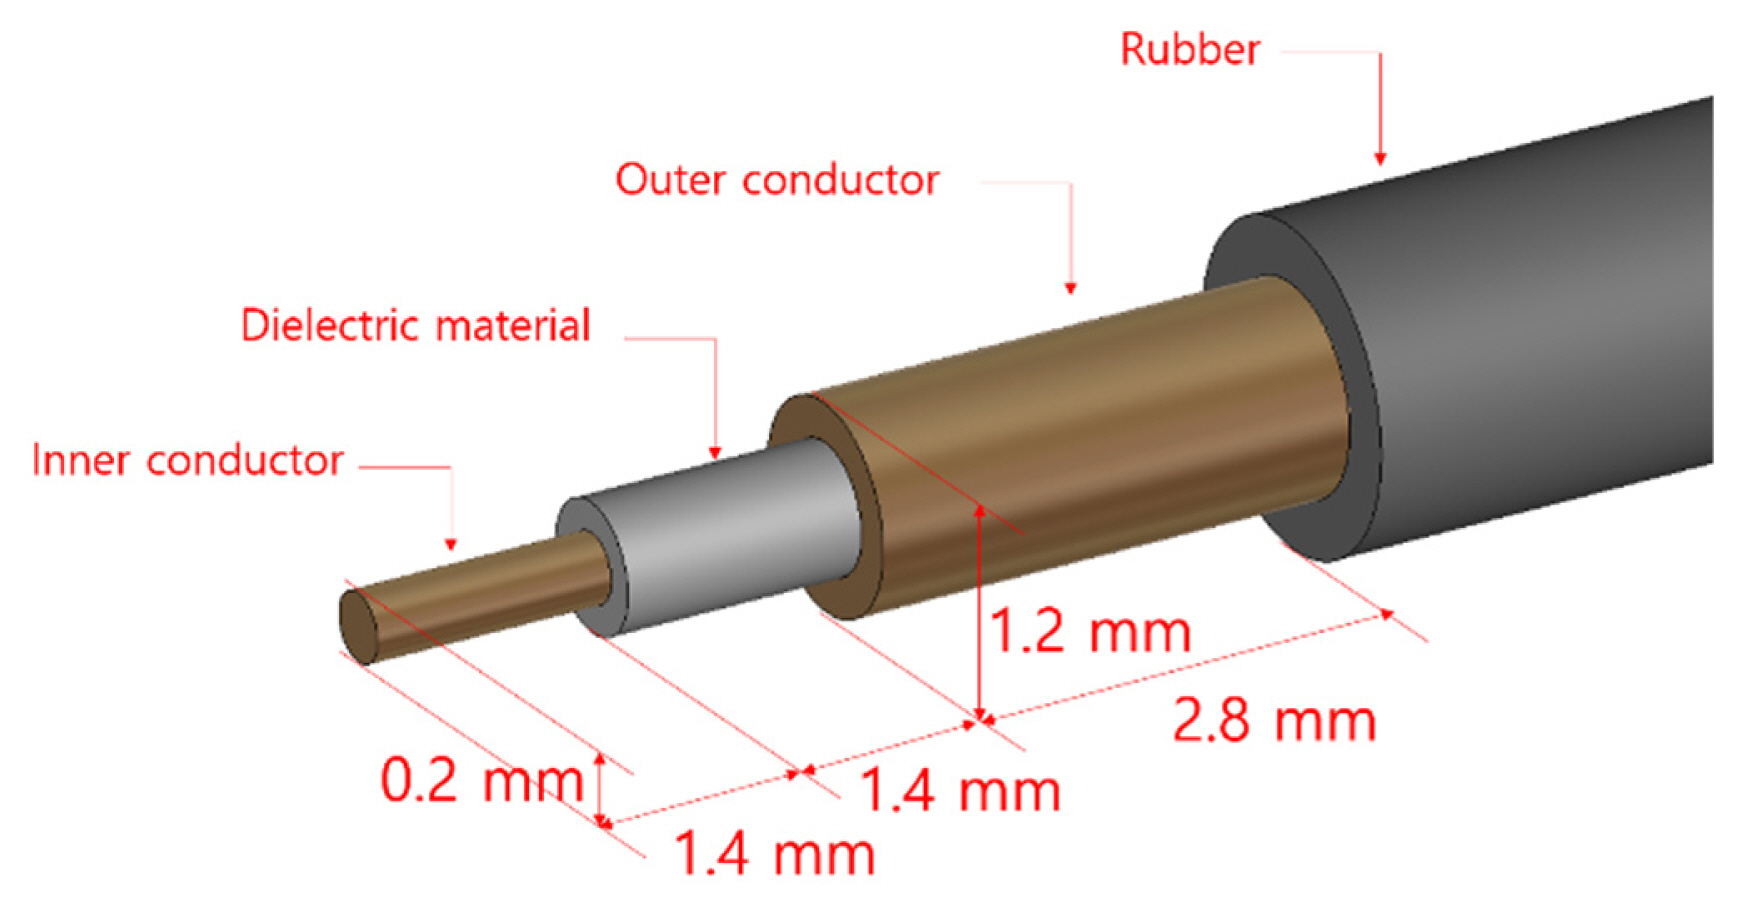
Coaxial voltage detecting probe.
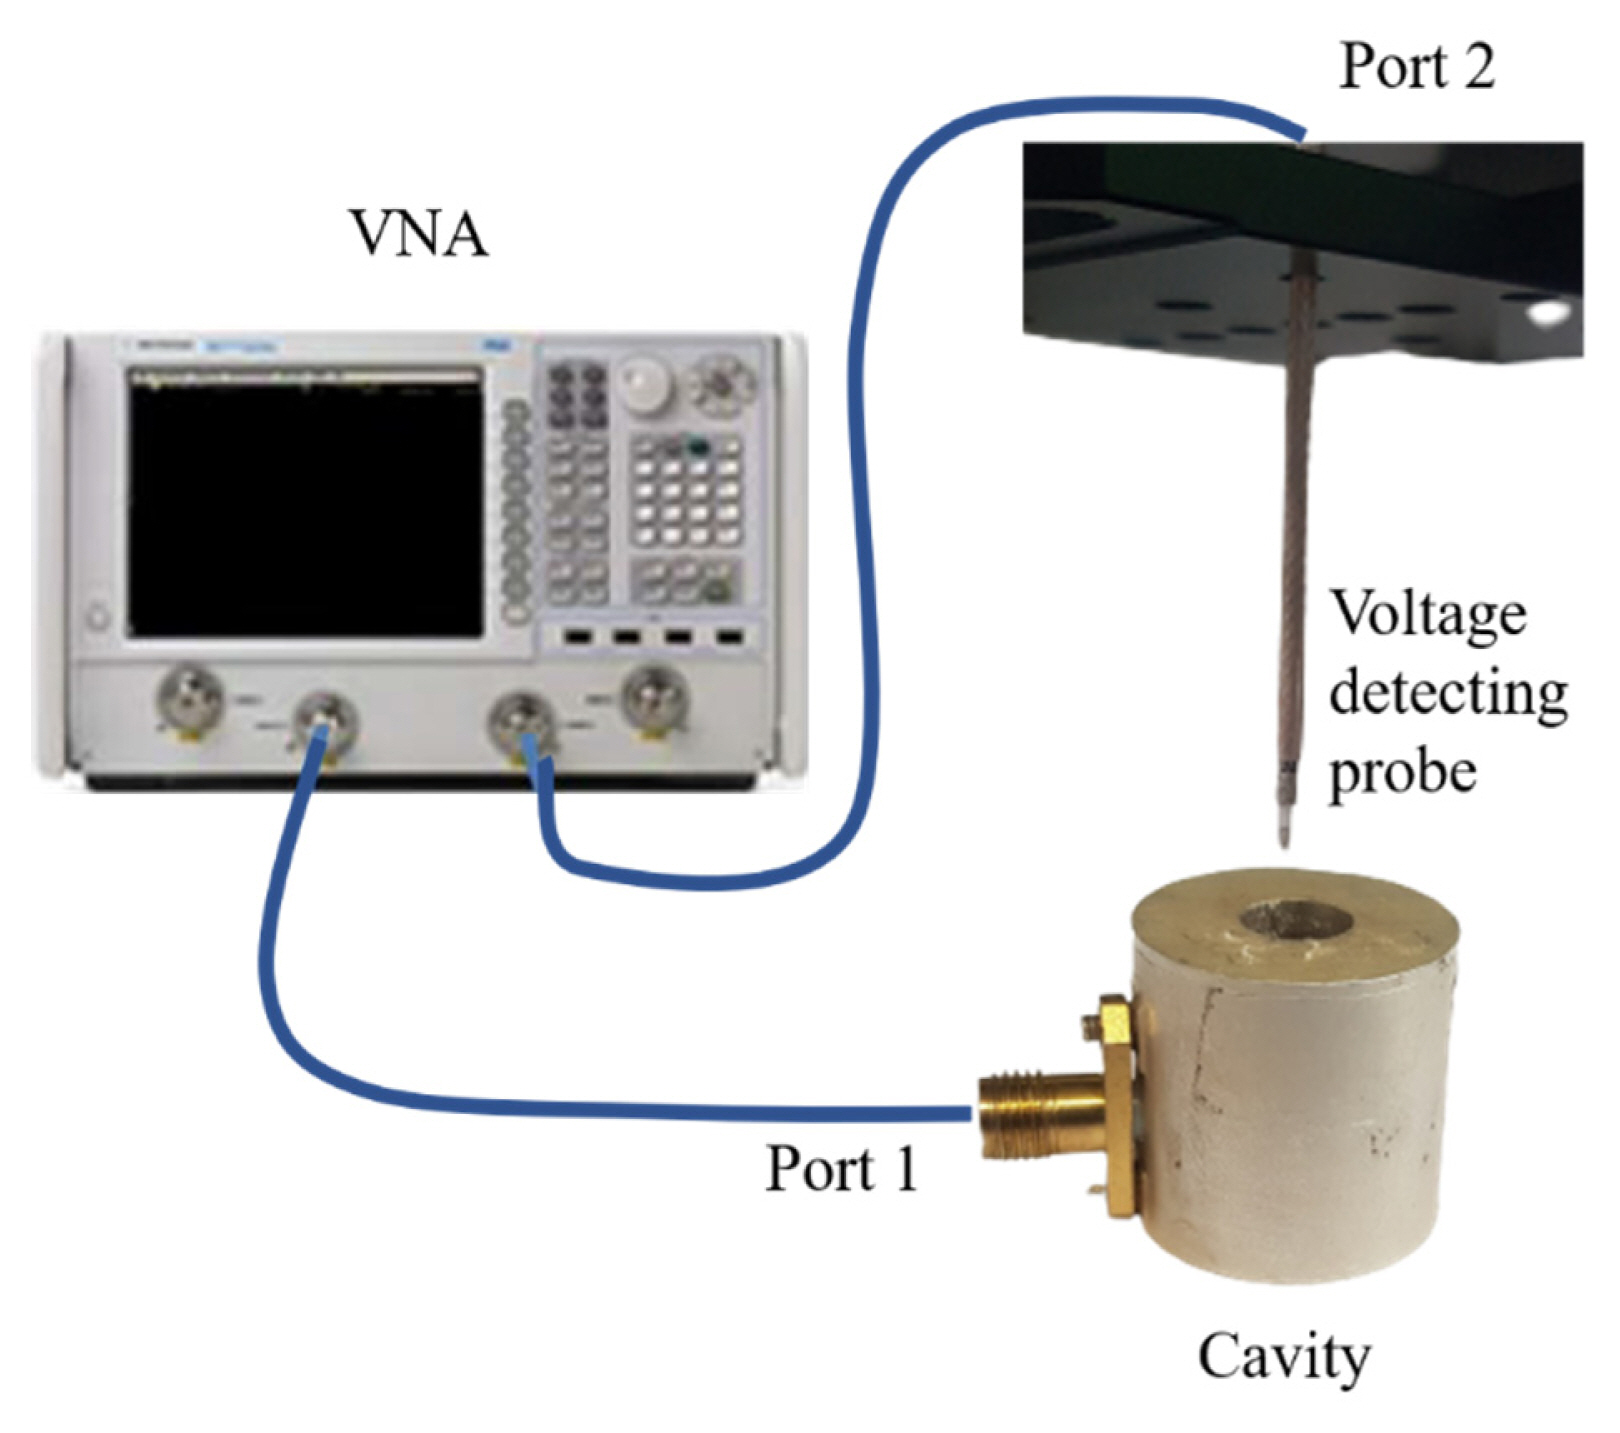
Experiment setup for an electric field measurement inside the cavity.
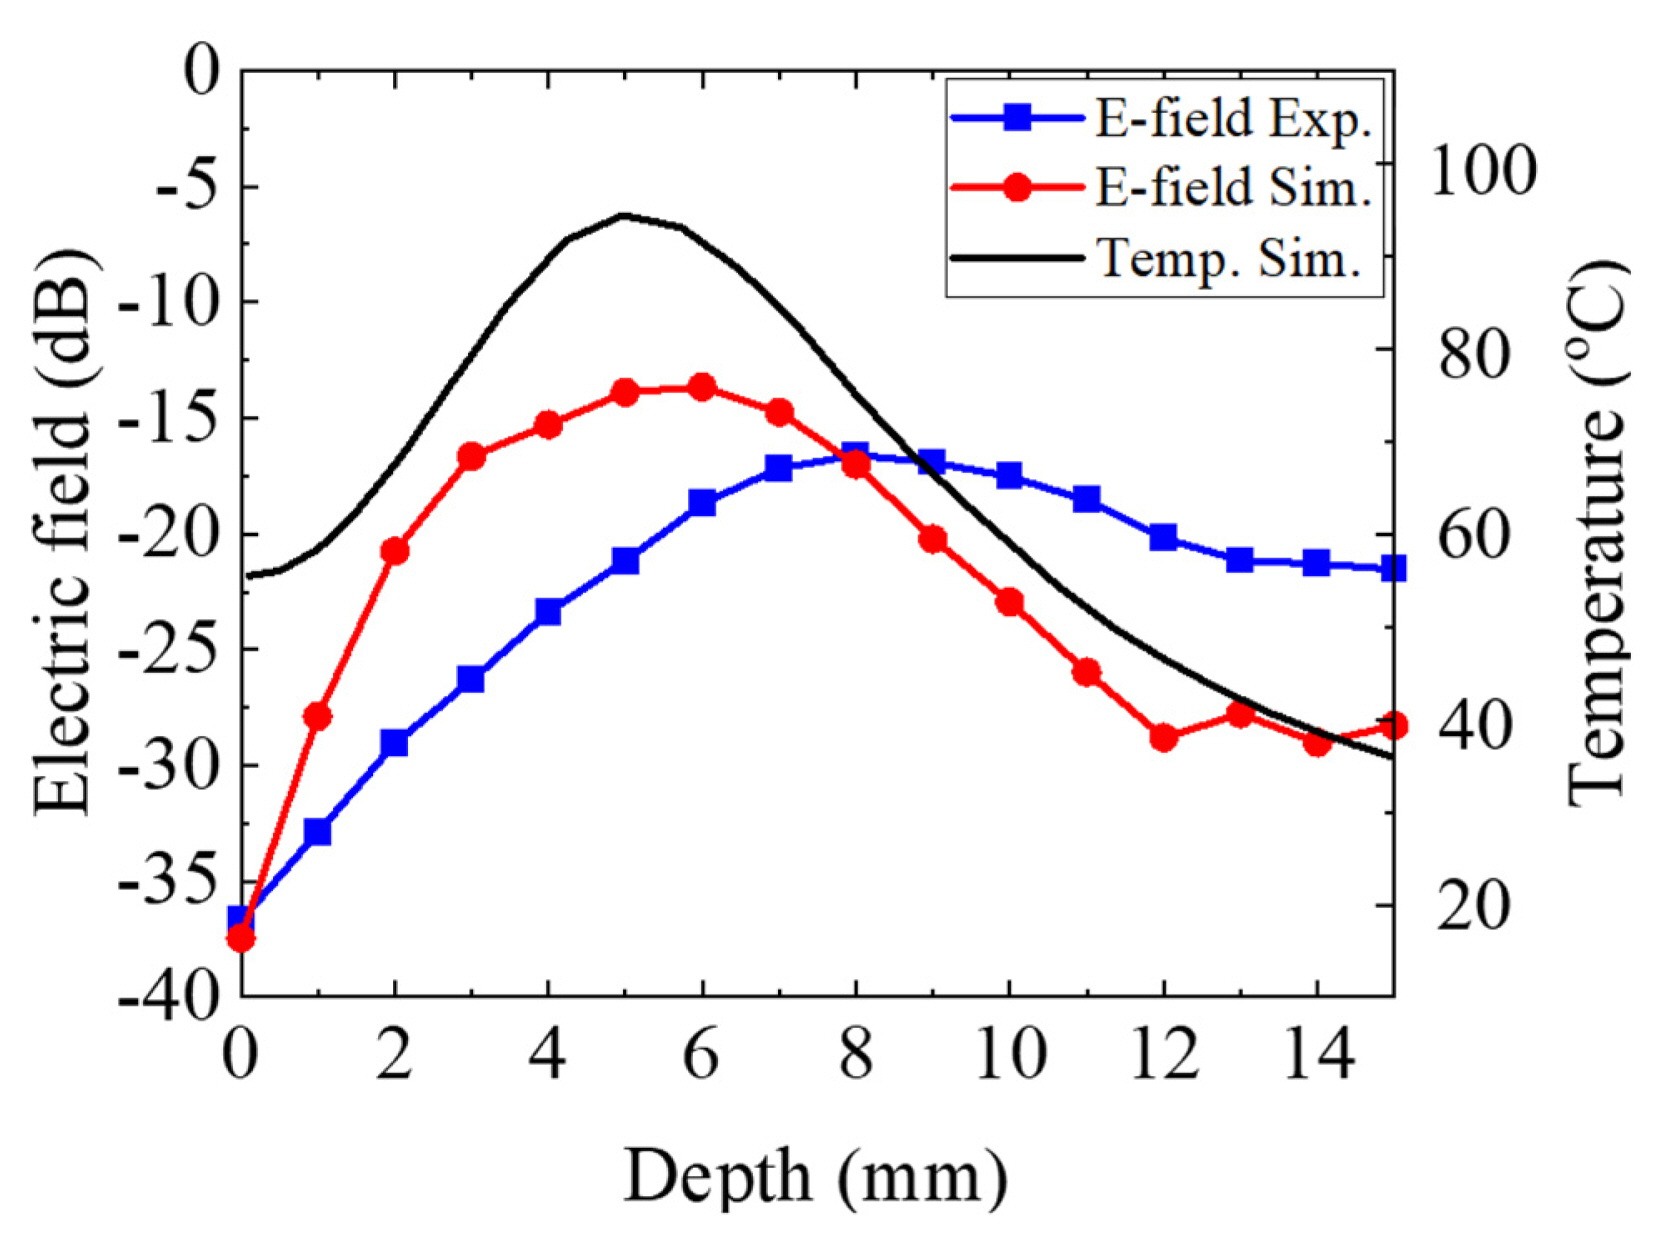
Comparison of the electric fields between the experiment and the simulation and the predicted temperature of the target material.
VI. Conclusion
To devise a small, practical, and portable microwave heating system, the frequency needs to be considered. For an affordable microwave source, a few GHz is preferred to heat the target. To heat a small target, the container resonant frequency should be reduced to lower than that of the unloaded cavity. The insertion of a low-loss background dielectric material has been considered and analyzed in this paper. The analytical formula has been introduced with a multi-layered dielectric material in the cavity and compared with the numerical simulation. We have made the cavity mainly heat the target area rather than the background by applying a specific mode inside the cavity so that we can increase the heating efficiency. Some discrepancies between the simulation and the experiment have been found and analyzed, considering the imperfect geometry, such as air gaps in the dielectric materials. The derived formula is useful for calculating the resonant frequency in a coaxially loaded cylindrical cavity. The microwave heating efficiency has been analyzed with varied target dielectric properties. It demonstrates that microwave heating can be effectively performed with a low-loss dielectric background material that reduces the resonant frequency of the container. In the experiment, we measured the electric field inside the target material. By measuring the electric field intensity and the pattern, the temperature profile can be indirectly inferred since the power absorbed by a dielectric material is directly related to the electric field intensity. The measured electric field shows a good agreement with that of the simulation, confirming that the microwave heating is concentrated on the center of the target, as expected in the simulation. By comparing simulation and experimental results, this study provides mathematical modeling of a multi-layered dielectric resonant structure to reduce the resonant frequency in microwave heating.
Acknowledgments
The authors acknowledge Prof. Gangil Byun’s help in the experiment using the vector network analyzer (VNA). This research was supported by the R&D program through the National Fusion Research Institute of Korea (NFRI) funded by the government (Code No. CN1901) and by the U-K Brand Future-core Research Fund of the Ulsan National Institute of Science and Technology (No. 1.200032.01).
References
Biography

TaeGyu Han earned a B.S. degree in physics from the Ulsan National Institute of Science and Technology (UNIST), Ulsan, South Korea in 2019, where he is currently pursuing a Ph.D. degree in physics.

YouMin Seo earned a B.S. degree in electronics engineering from Myongji University, South Korea. He is currently a B.S. and working as a radio frequency passive device design and electromagnetic simulation engineer since 2016.

EunMi Choi obtained a Ph.D. degree in physics from Massachusetts Institute of Technology (MIT), Cambridge, MA, USA, in 2007. Currently, she is a professor in the Department of Electrical Engineering, Ulsan National Institute of Science and Technology (UNIST), South Korea. Her research interests include development of high-power millimeter-wave and THz sources, THz components and transmission lines, and novel THz applications, including 6G communications.