J. Electromagn. Eng. Sci Search

CLOSE


J. Electromagn. Eng. Sci > Volume 21(4); 2021 > Article
Enegbuma and Kim: Analyzing DC and AC Magnetic Field Intensity, Distribution, and Relationship in a Hyundai IONIQ 2016 Electric Vehicle

Abstract

This study aimed to evaluate the direct current (DC) and alternating current (AC) electromagnetic field (EMF) intensity and distribution of an electric vehicle (EV). The results revealed that the EV generated DC and AC EMFs, which differed depending on the operation (resting, idling, and driving at speeds of 40 and 80 km/h). A correlation was established between the AC and DC components of the EMF, which was approximately 0.5 when idling and 0.8 at speeds of 40 and 80 km/h. The results obtained were below the harmful limit set by regulatory agencies, specifically the International Commission on Non-Ionizing Radiation Protection (ICNIRP) and the Institute of Electrical and Electronics Engineers (IEEE). To further contribute to this field of study, the various measurement equipment used in the literature are summarized according to their parameters.

I. Introduction

The low electromagnetic field (EMF) produced by electric vehicle (EV) engines and electric components might pose a health risk to the driver and occupant(s) [14]. Several studies have investigated this possibility, but there is no general consensus as to whether the MF levels generated cause harm to humans. EV usage and patronage is on the rise due to global concerns regarding greenhouse gas emissions, which are projected to double by 2050 if current energy consumption indexes persist [5]. Additionally, the governments of some countries have implemented tax waivers and other benefits to entice consumers to purchase EVs [6, 7]. This is in line with global climate change policies, such as the recent Paris Agreement of 2016 [8].
To address the concern of the potential harm of EVs, several researchers have measured EMF levels and compared these measures to the limits set by regulatory agencies. Predominately, the most commonly used regulations are those of the International Commission on Non-Ionizing Radiation Protection (ICNIRP) [9, 10] and the Institute of Electrical and Electronics Engineers (IEEE) [11], but other agencies [1215] have different limits due to differences in opinion and scientific deduction [16, 17]. For example, the BioInitiative Working Group [17] argued that the ICNIRP limits were obtained using anatomical models and thus may not reflect the real human body. Other studies have observed and recorded human physiological reaction to EMF exposure, such as delayed response time [18, 19], visual problems [10, 2022], and aggravated annoyance [23].
Tell et al. [24] measured and averaged EMF emissions in 14 different EVs and hybrid EVs to obtain a mean value. Hareuveny et al. [25] assessed 10 vehicles and provided a range of average EMF values for each vehicle and levels at various points within the vehicles. They found notably stronger EMF in EVs compared to internal combustion engine vehicles. Halgamuge et al. [26] measured and reported the level from a single hybrid EV at different points in the vehicle. Vassilev et al. [27] compared the EMF levels of 11 different cars using 11 sample points. Vedholm and Hamnerius [28] measured the readings of seven cars using 20 sample points. Their study was the first to hypothesize that the battery position may have some effect on EMF emission production. Stankowski et al. [29] considered the driver’s head and feet position as important for EMF EV testing. This was based partly on the ICNIRP’s conclusion that the head (specifically the eyes) is a target area [9, 10].
Monero-Torres et al. [30] initiated EMF deduction using simulations. In their experiment, they theoretically deduced the EMF for an EV via finite models using the EV’s battery and later its inverter [31]. Campi et al. [32] used numerical characterization to assess the EMF of an EV with a wireless power transfer system. Lennerz et al. [33] assessed the EMF within several cars to investigate its effect on cardiac implants. Ruddle et al. [34] assessed EMFs caused by current transients within the EV. They hypothesized that human harm is likely. Milham et al. [35] assessed EMF considering the steel-belted radial tires of the EV. The study established that the tires are sources of EMF, but the level dropped when measurements were taken within the vehicle, which is in line with the findings of [29]. Ruddle et al. [34, 36] employed simulations to test several EV models and reported a value of 52.9 μT. Other reports have also delt with this subject matter [3742]. Snyder [43] was awarded a government grant to study EMF shielding in EVs. Pittsyna et al. [44] reviewed past studies and estimated the EMF of an EV to be 129 μT.
Although numerous studies have revealed the EMF levels generated by various EVs, these previous studies have had several drawbacks:
  1. The experiments conducted were not replicable in some situations (e.g. [45]);

  2. Parameters such as amplitude, field type (if DC or AC), frequency spectrum, and field distribution complicated the task of measurement with relation to biological creatures (e.g. [45]) and;

  3. It remains unclear which regulatory agencies’ limits are best suited to this area of study.

The purpose of this paper is to determine the level of DC and AC EMFs generated in an EV; reveal their relationships; and obtain the EV’s EMF intensity, distribution, and frequency for different operating conditions. We reviewed previous studies to determine the best measuring equipment and environment for data collection, how to interpret the results, and which regulatory agencies’ safety limits to compare the results to.

II. Methodology

As already mentioned, previous studies have used different protocols, such as spot measurement, continuous measurement, or measurement at varying speeds, as well as different equipment. While reviewing previous studies, we noted the EMF levels found, measuring equipment used, frequency range, vehicle type, data collection environment, and type of field measured. Based on these previous reports, we noted a gap in terms of the use of a new technologically advanced meter specifically designed for detecting extremely low-frequency (ELF) fields. The various measuring devices available were analyzed based on the device specifications.
Its AC measurement was in the range of approximately 16 to 2,000 Hz. Additionally, it used either fast Fourier transformation for frequency domain measurements or the weighted peak method in the time domain mode, which offers great precision. The Vector/Magnitude Gauss Meter (Alpha Lab, Salt Lake City, UT, USA) was also used and fitted with a Hall probe to increase its accuracy in detecting DC magnetic fields. Magnetic field data were collected using the Gauss meter for DC magnetic field information and NFA 1000 meter for AC magnetic information.
Data collected were logged into a Microsoft Excel sheet (Microsoft, Redmond, WA, USA) and statistically analyzed using the 2016 Excel toolbox feature. The NFAsoft software (Gigahertz Solutions, Langenzenn, Germany) was used for the data analysis of the obtained EMF data. Table 1 highlights the vehicle specification [46]. A fully EV, the IONIQ 2016 (Hyundai Motors, Seoul, Korea) was used.
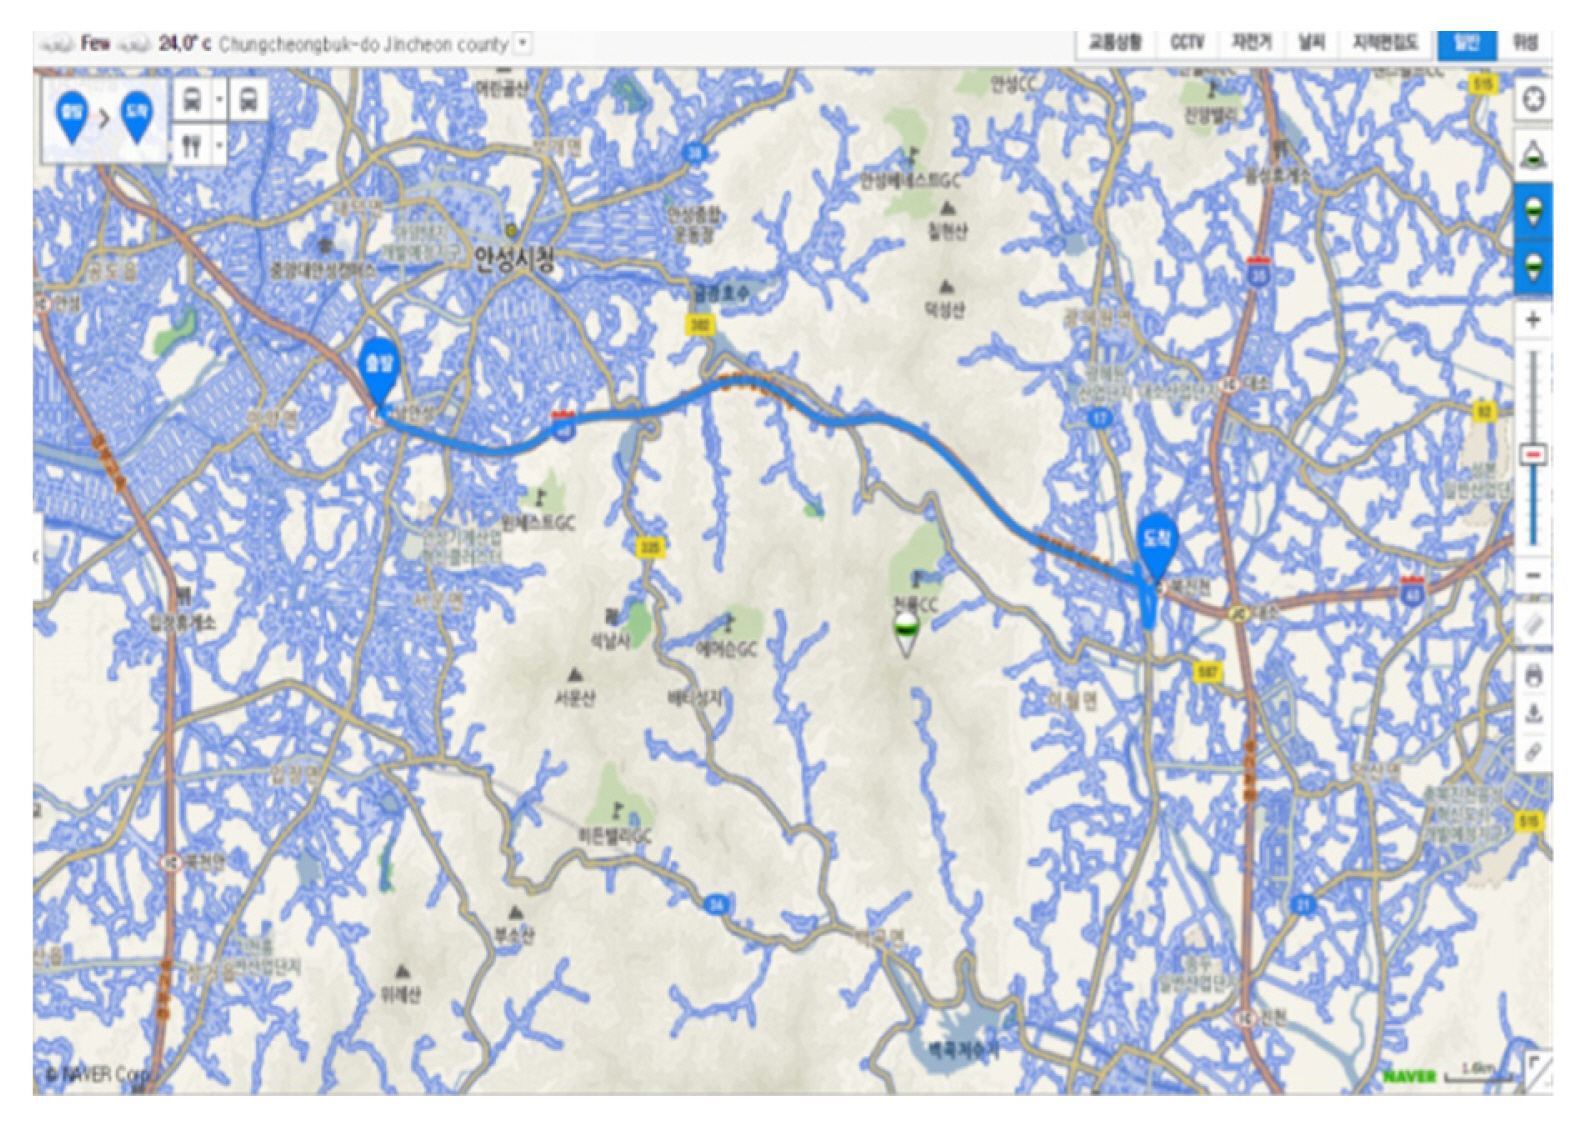
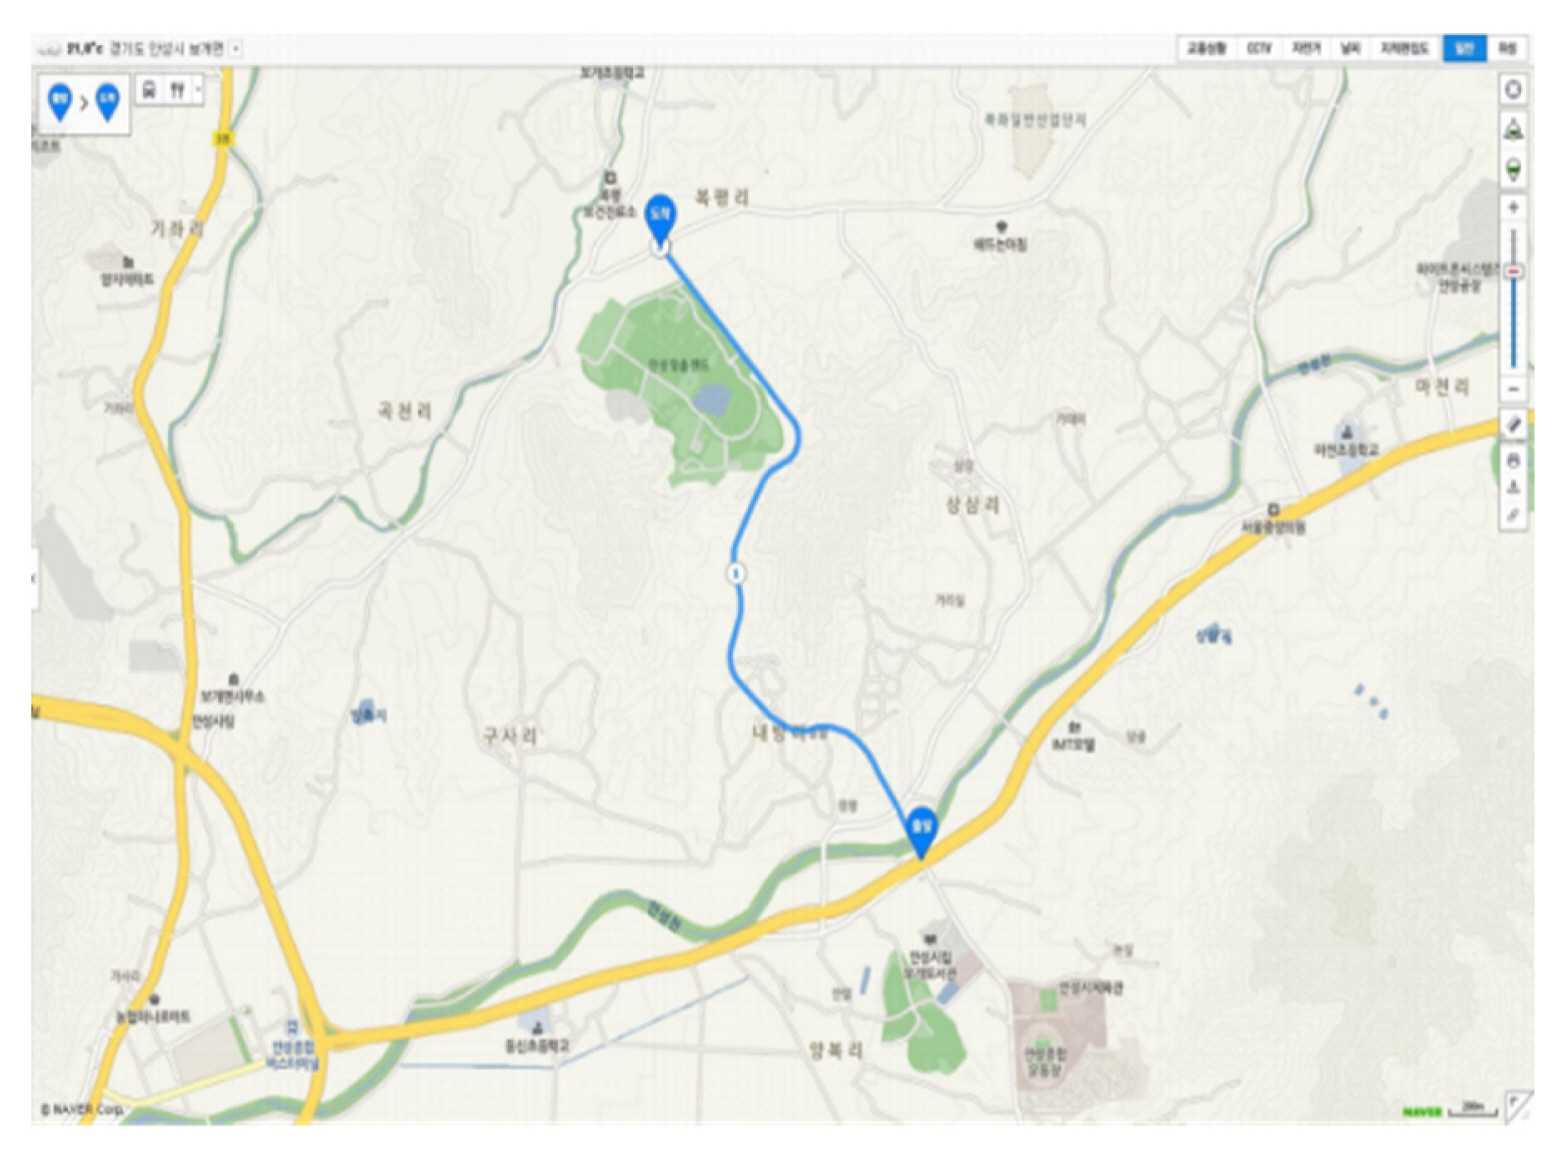
A route for the experiment was selected based on the following considerations. The route had to have open lanes allowing for speeds of up of 40 km/h, 80 km/h, and 100 km/h to be achieved. There also had to be comparatively low vehicular traffic and minimal interference from power transmission lines. Thus, the Anseong to Chincon expressway within the Gyeonggi-do province of South Korea was the route taken as the drive path. A map of the route is provided in Figs. 1 and 2, which show the locations of the roads travelled for fast- and slow-speed data collection.
Data were obtained for the following conditions: at rest and at speeds of 40 km/hr and 80 km/hr. These conditions were picked based on other papers with similar conditions (e.g. [24, 25]). Hence, the data can be compared to the results of those studies.
Fig. 3 provides the sample collection point(s) [47]. The order of sample collection went from left to right (rear to front): BLMN–IJK–FGH–CDE, with position A collected only during rest, startup, or idling. Idling here refers to when the car was on, but there was no acceleration or motion. The positions CFIL-DGJM-EHKN correspond to the head, chest, and feet region, respectively.
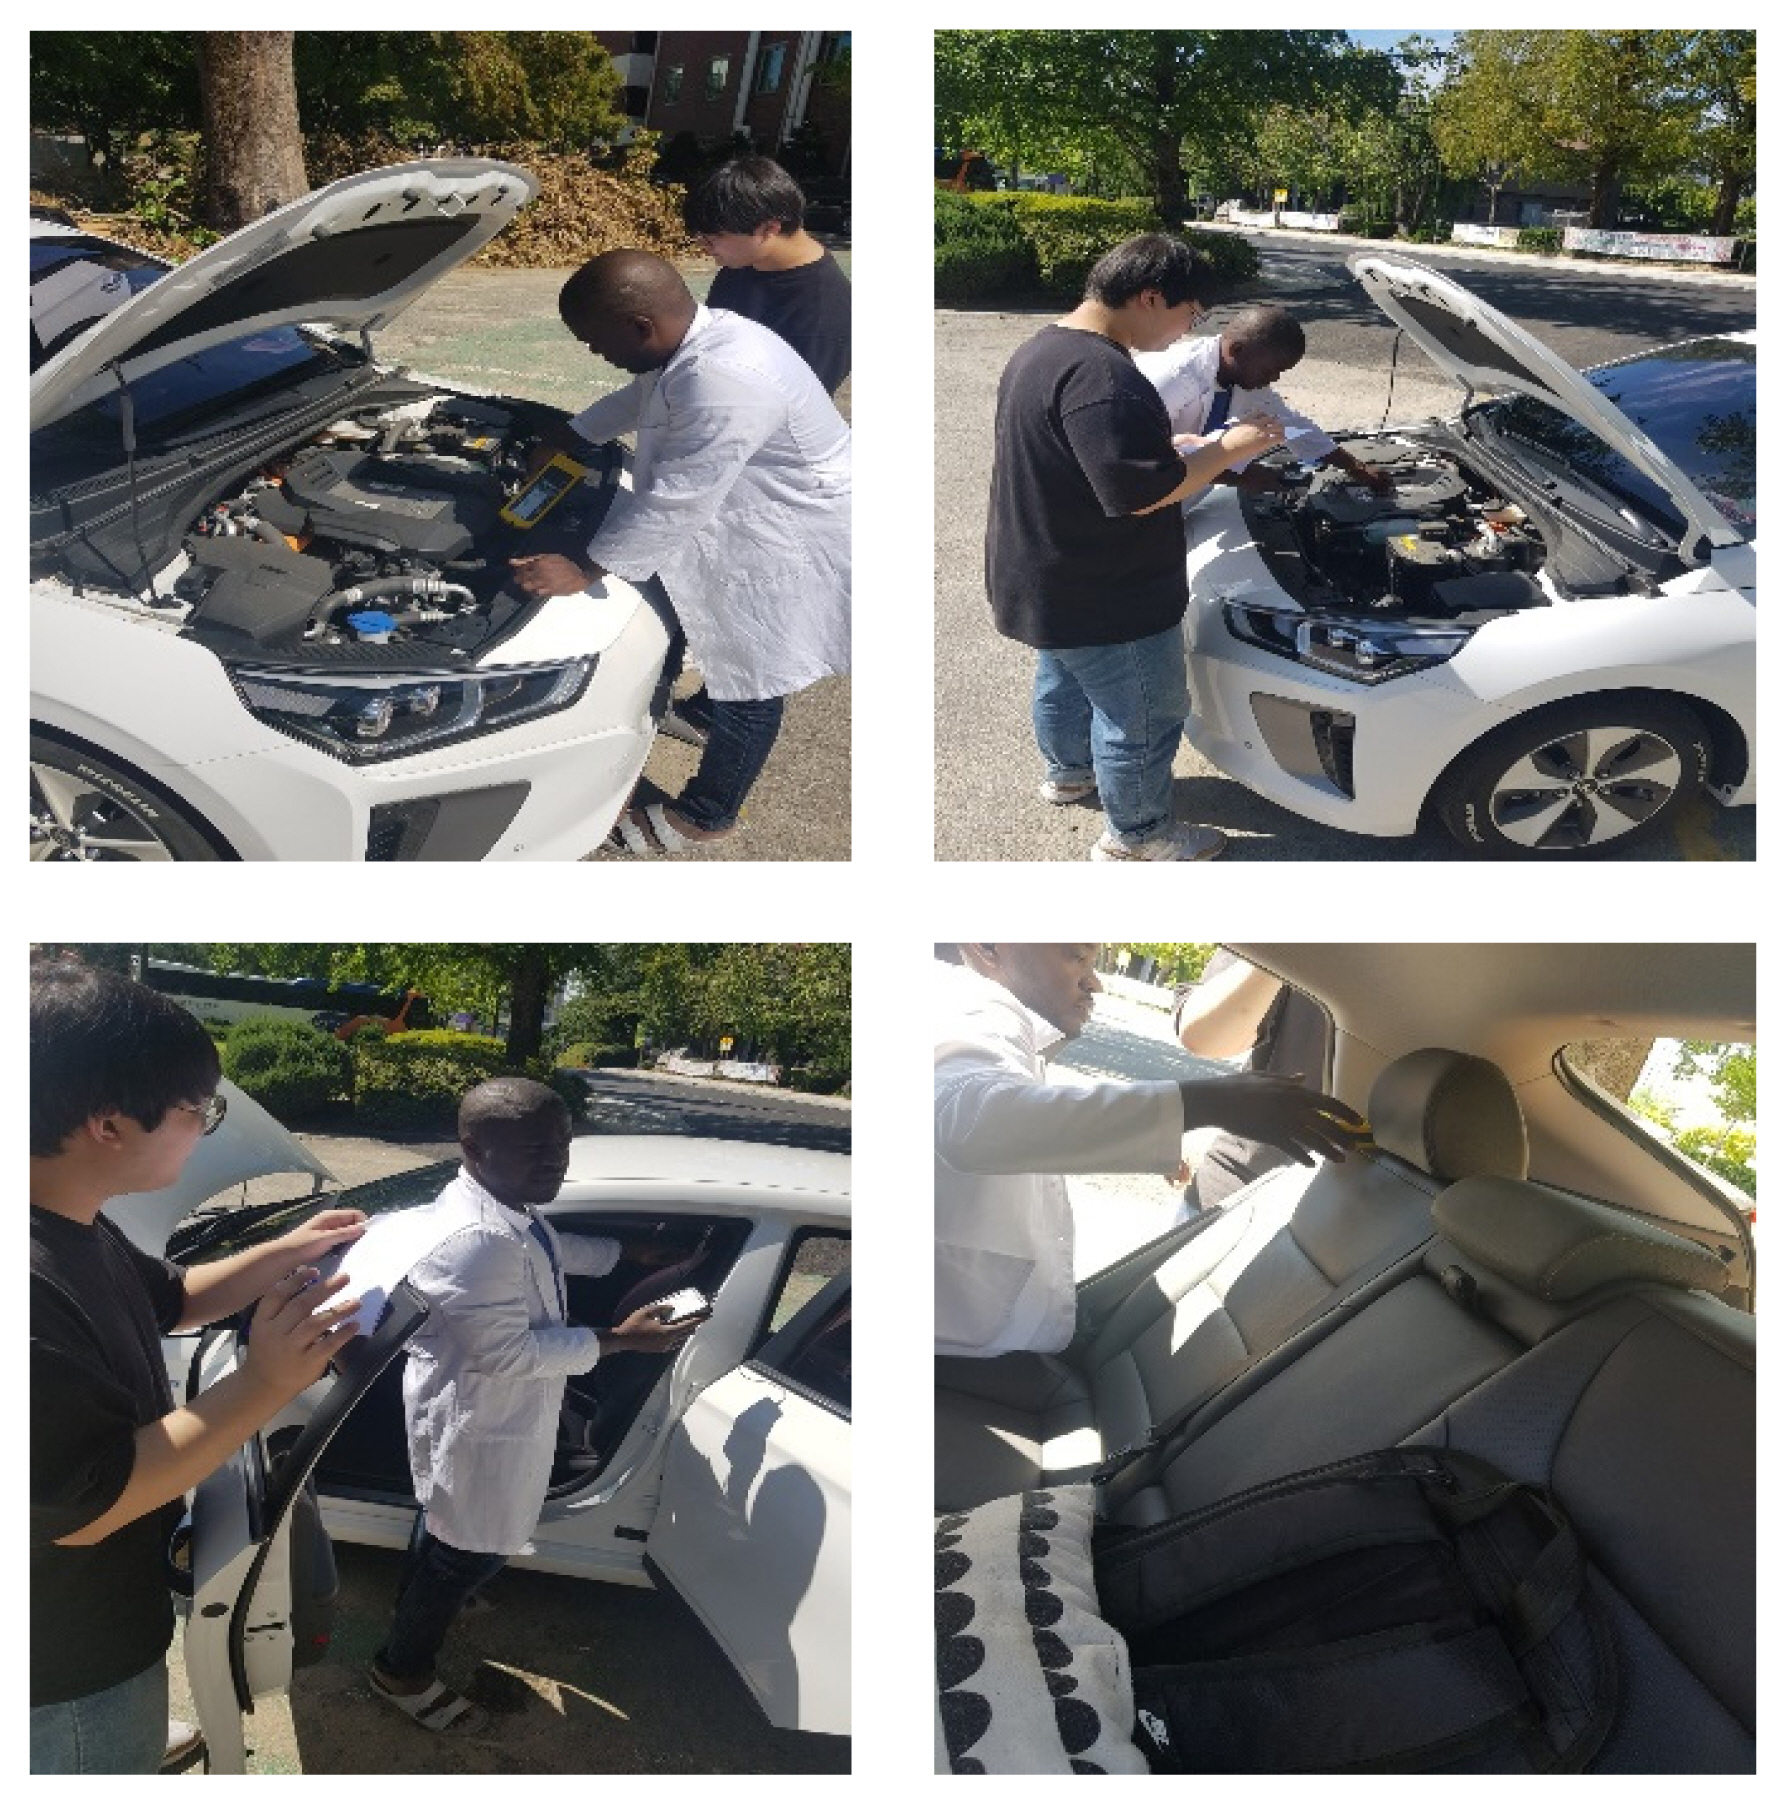
Fig. 4 provides a diagram of the position(s) earmarked in Fig. 3 and shows how the instruments were used to conduct the EV EMF test.
The equipment was calibrated at the beginning of the experiment according to the manufacturer’s specifications. NFA and NFAsoft were used to support the measurement of the working environment. In this case, the 6D feature was used to measure six positions (H, G, F, N, M, L) and to generate the EMF field pattern, as shown in Section III. In addition, the EMF field pattern in the horizontal plane was generated using the positions of nine points (HAE, F, C, between F and C, and LBI; 9D feature). The NFA software guides the user through the nine points by means of short audio signals (beeps). These nine points were processed in the order presented in Fig. 3. This method was used to ascertain if the EV emits DC and AC EMFs.

III. Result

Table 2 provides specifications for the most used EMF meters from various studies. Based on these results, EMF data in our study were collected using the Gauss meter for DC MF and the NFA 1000 meter (Gigahertz Solutions) for AC MF due to their advantages in terms of accuracy and data logging. Table 3 displays the data obtained from the road test. The DC and AC components of the EMF generated at different operating conditions were obtained and recorded. Additionally, the frequency levels at each sample collection point were also recorded. The results revealed the difference in frequency for different sample point(s).
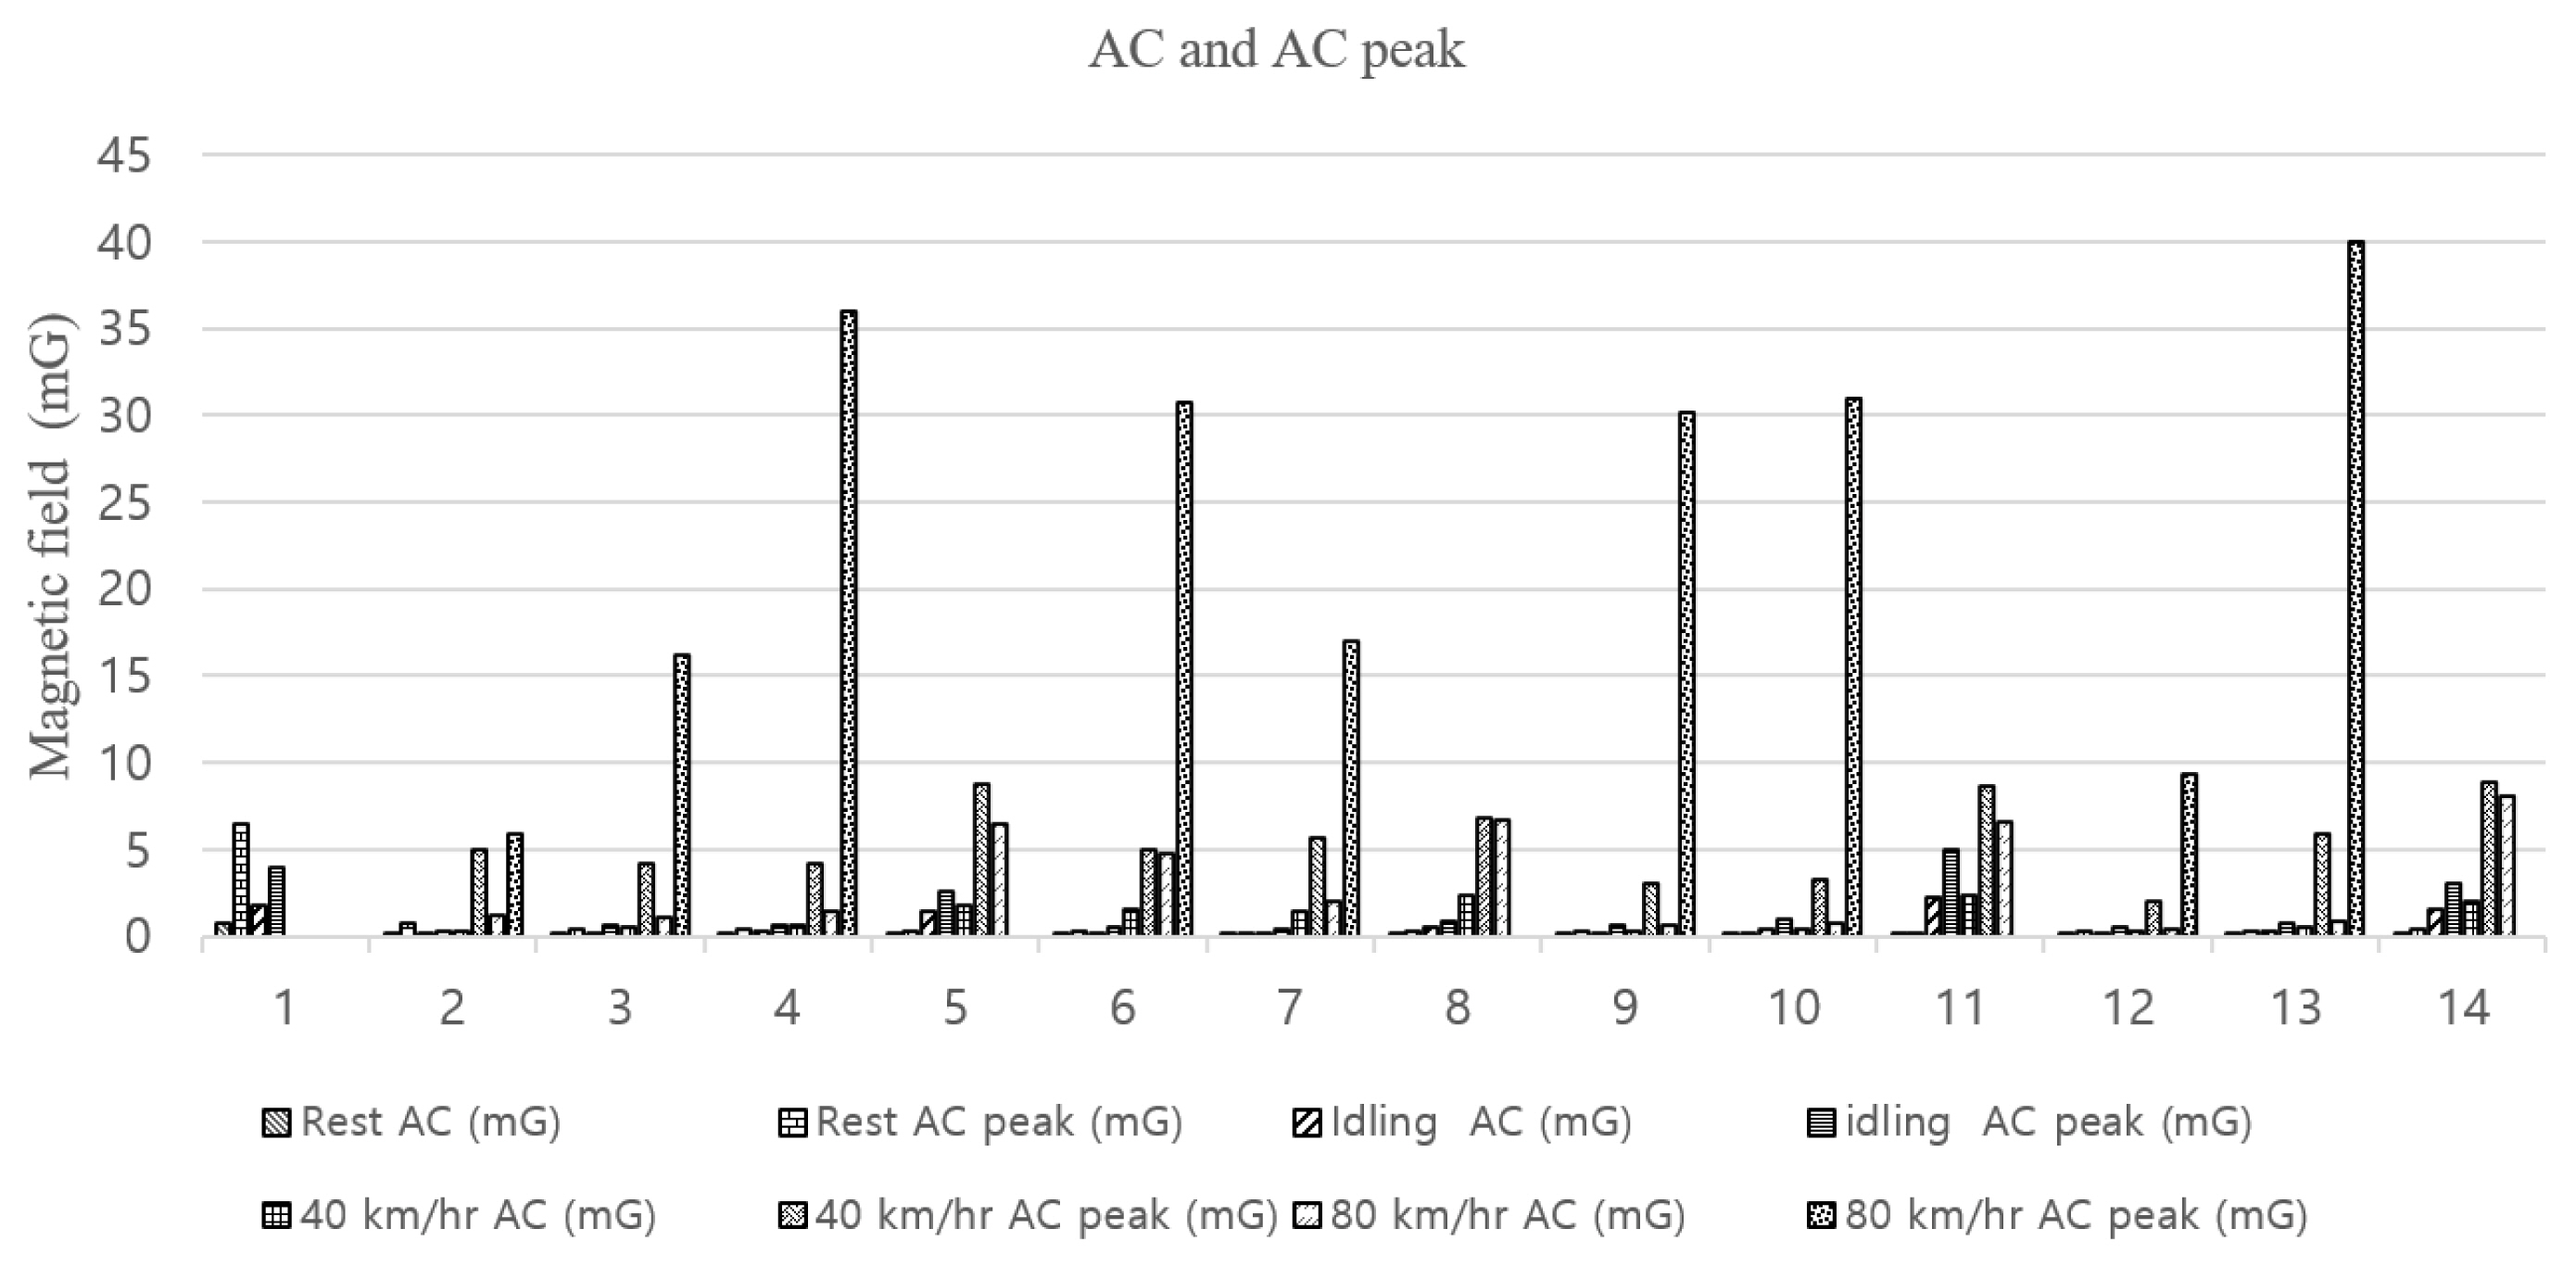
As seen in Table 3, the NAF meter recorded AC and AC peak data. Fig. 5 graphically represents their relationship.
The data were analyzed using the statistical tools provided in Microsoft Excel to determine the correlation between the AC and DC fields detected. Table 4 shows the correlation coefficient between the DC and AC EMFs analyzed under different operating conditions [46, 4850]. The relationship between the DC and AC fields at rest was negligible. While idling, there was an increase, but the correlation was low. When changing speeds, they were strongly positively correlated. This can be interpreted as an increase in speed results in greater EMF generation.
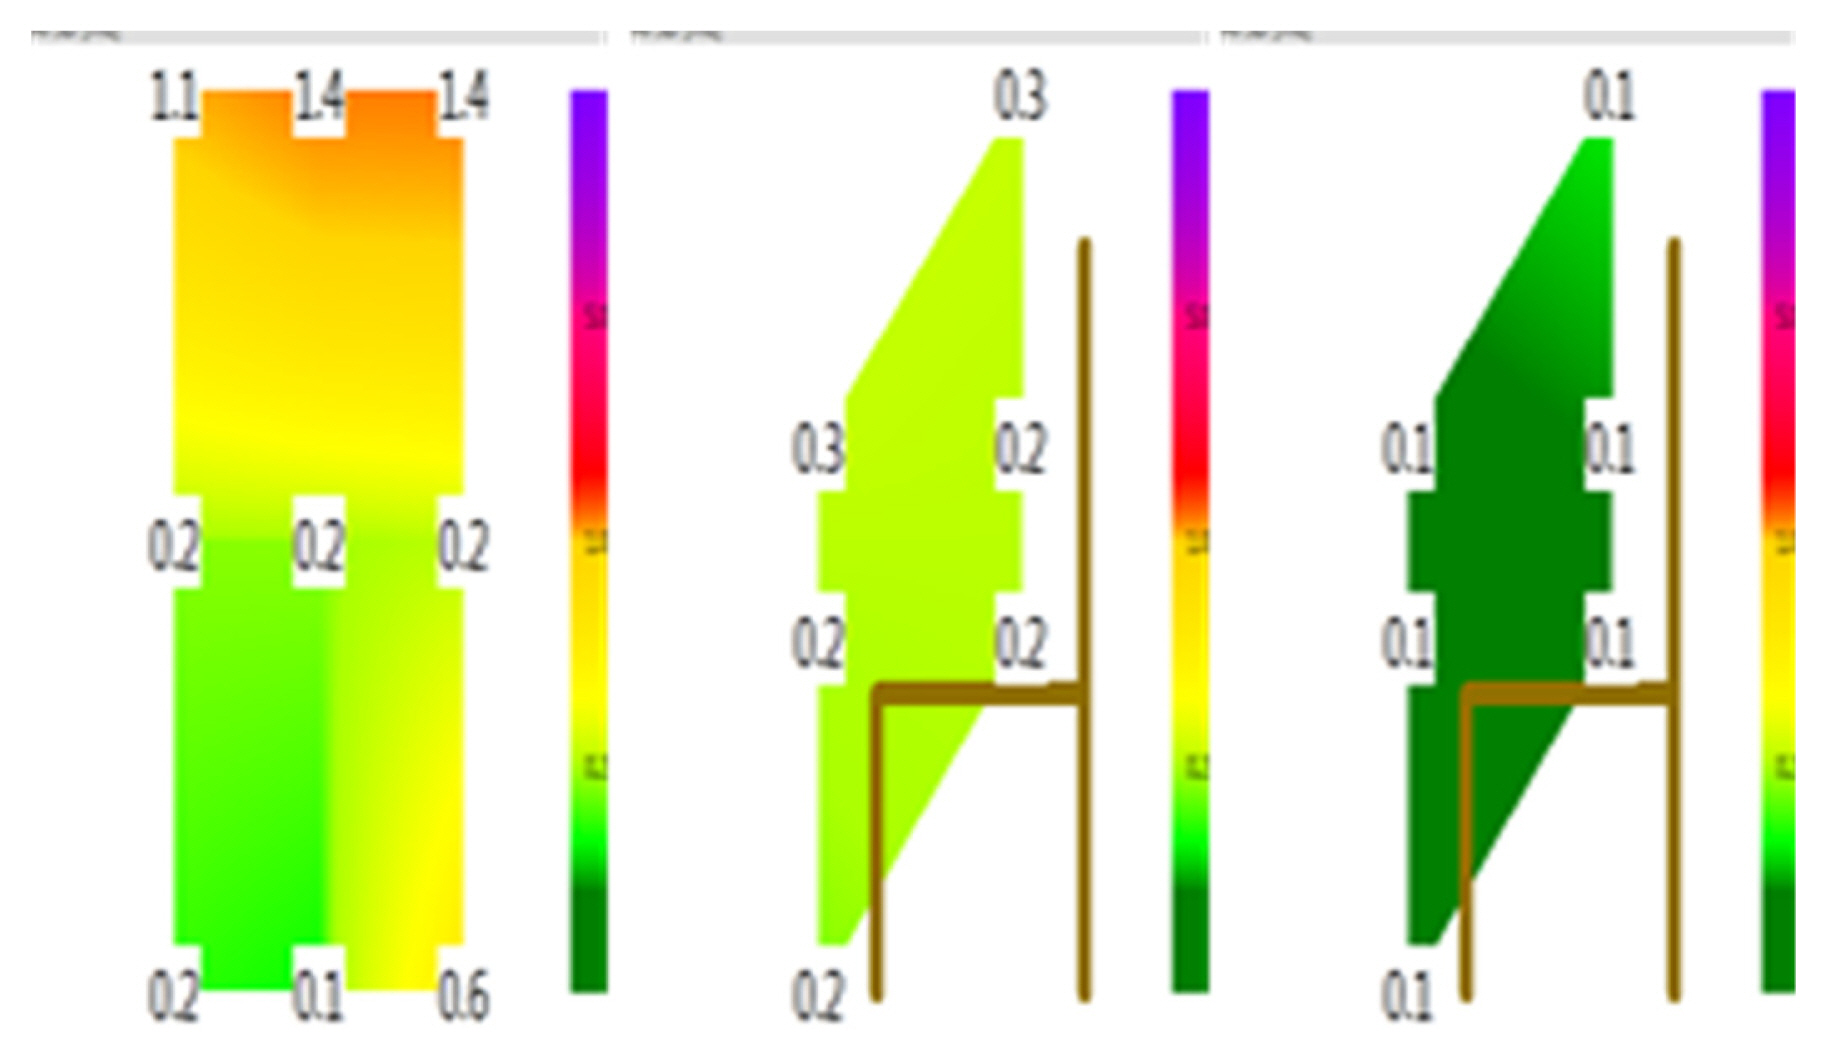
Next, the field distribution pattern was obtained using NFAsoft for the car at rest and when idling. Fig. 6 shows the field pattern using the data obtained for the EMF and the varying frequencies obtained at different points during measurement. The image shows an aerial view of the EV similar to a horizontal (or flat) plane (9D) and a vertical representation capturing the seating position from head to feet (6D).
As can be seen, a field pattern was found, with the bulk of the field at the front section of the EV. The seat positions were analyzed again when the car was switched on. Fig. 7 shows the field distribution. There was a considerable increase in EMF due to the change in the operating condition of the EV. A clear indication of a stronger EMF as the car moved from idling to low speeds of 40 km/hr is hereby firmly established.
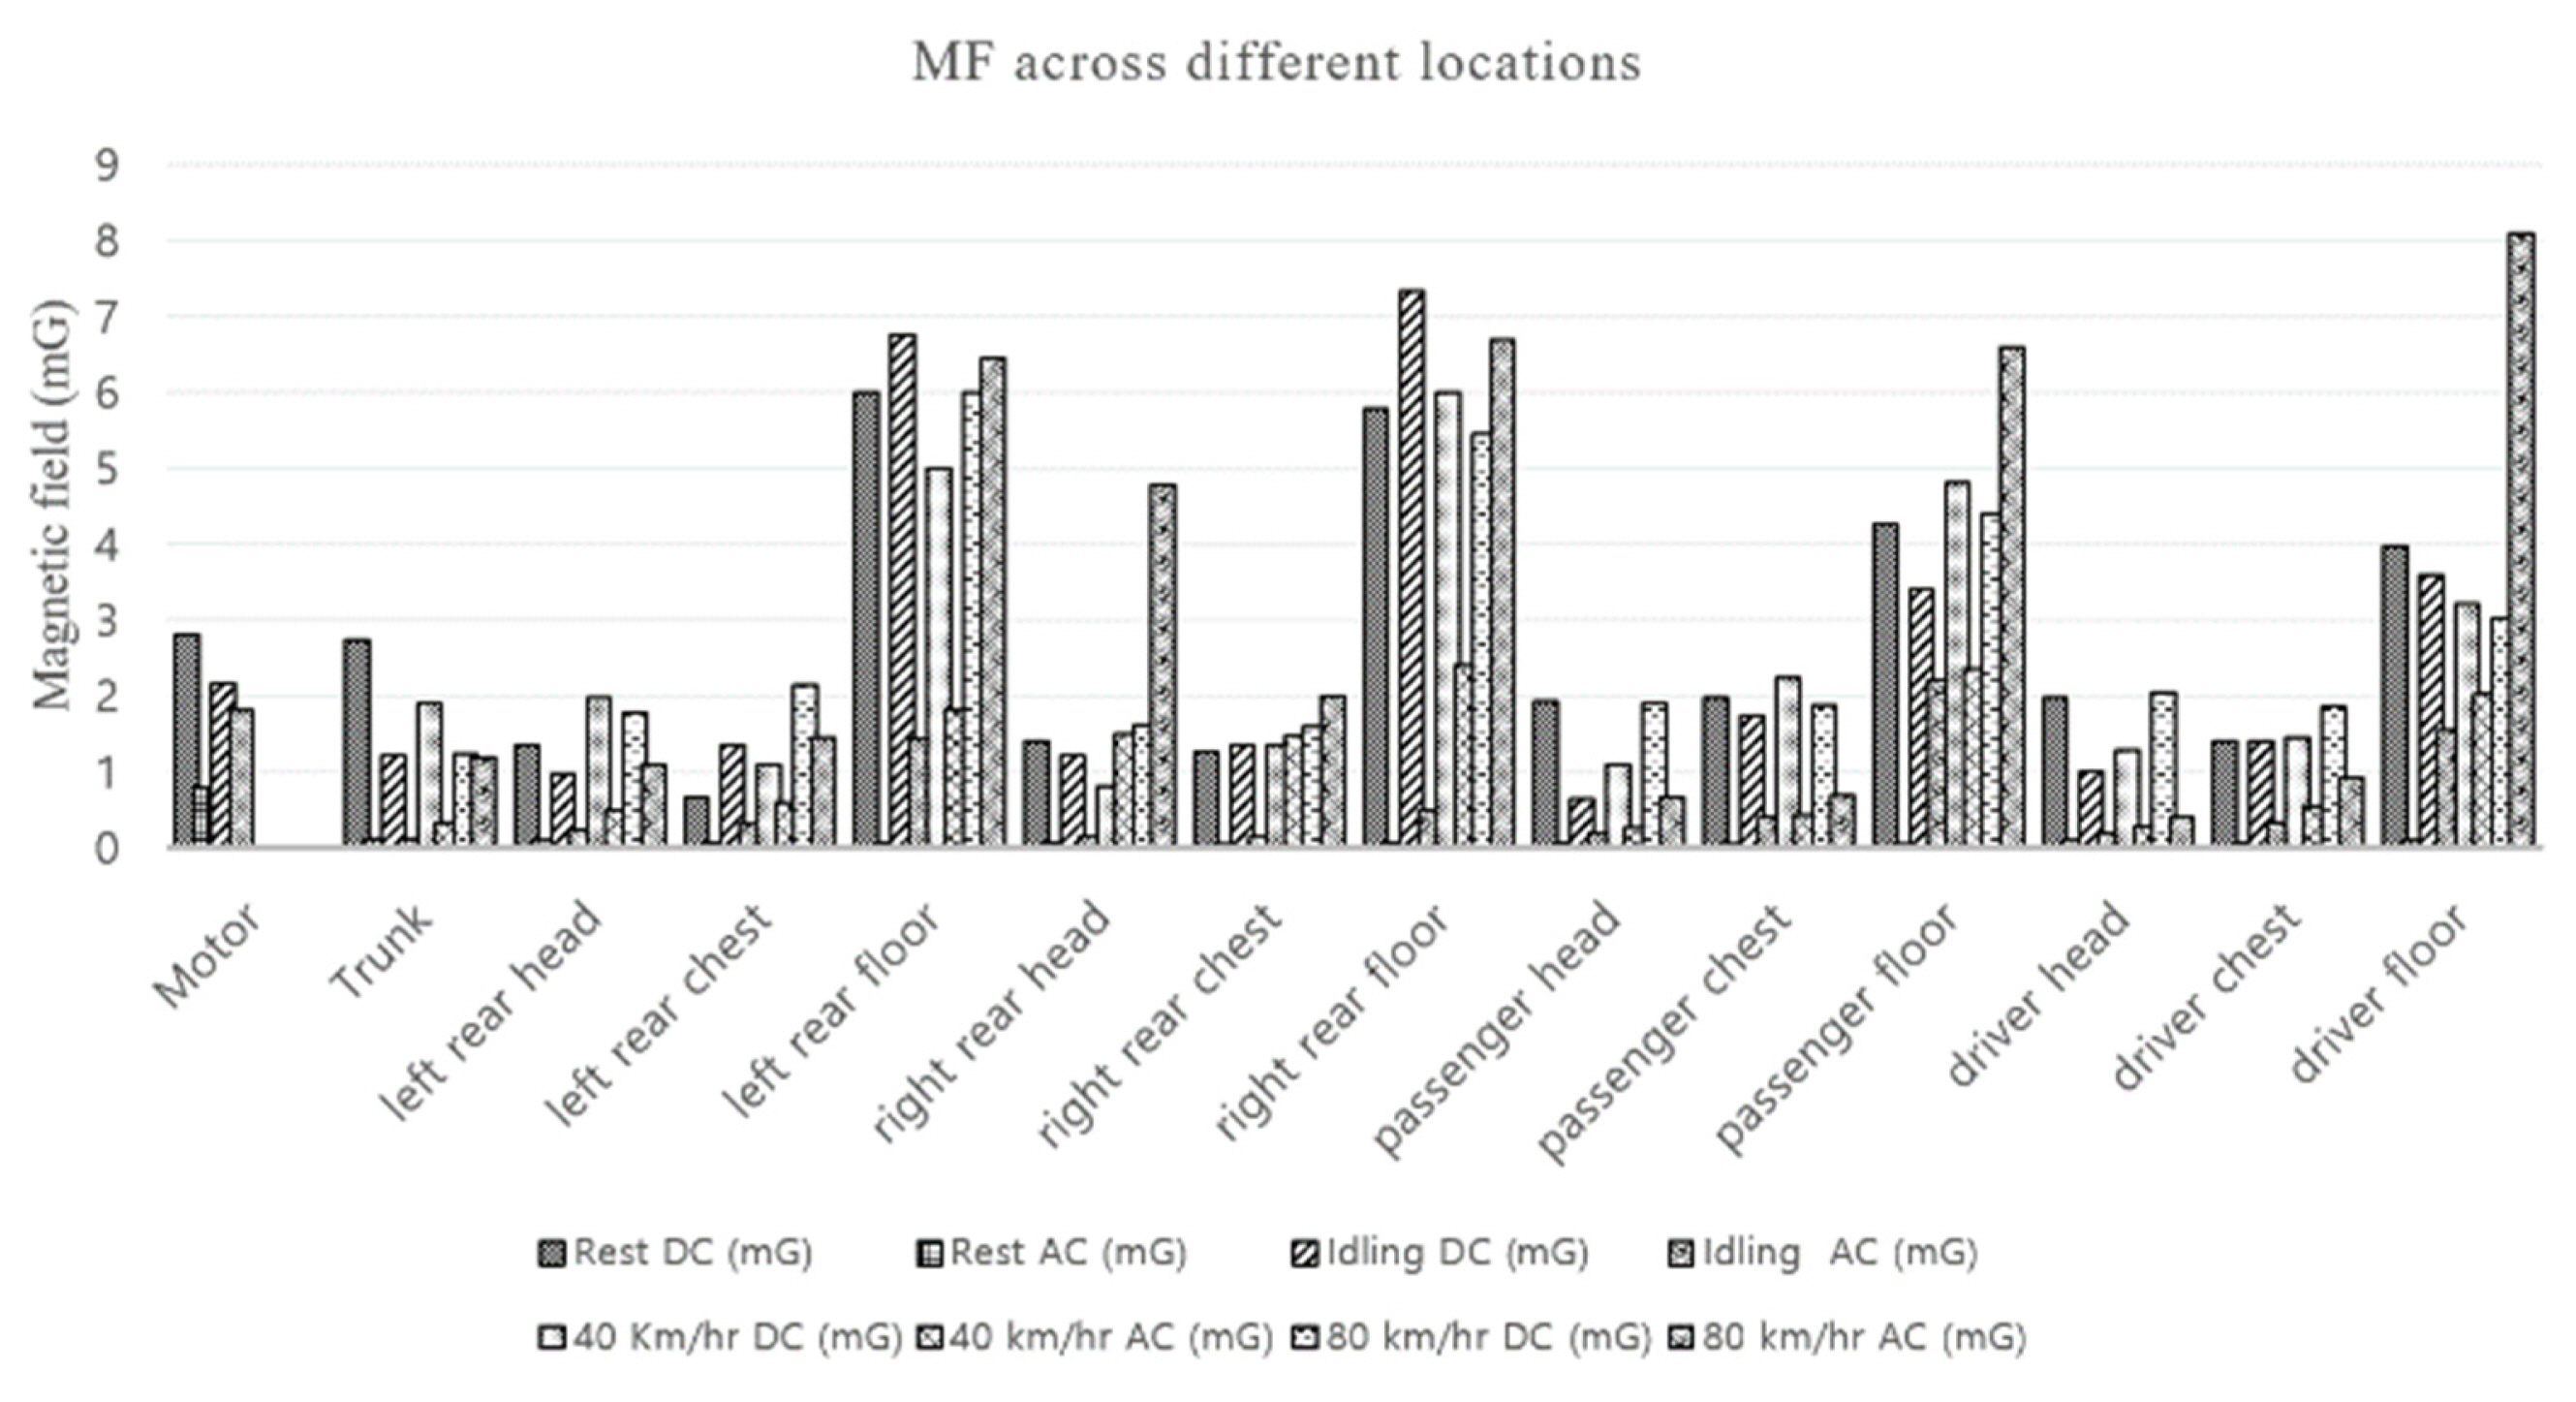
Finally, to determine the location with the highest EMF level (potential harmful zone), a bar chart was created from the data obtained (Fig. 8). The sample points from Fig. 3 (with the exception of points A and B and peak data) are grouped.
As seen in Fig. 8, the feet/floor region emitted the highest level of EMF. The field levels were almost the same in each section, with the exception of the left rear chest and right rear chest regions. A maximum value of about 6.00 mG was obtained during the test drive, with an average of 1.41 mG and SD of 1.12 mG.

IV. Discussion

In most of the previous research, the EMF obtained from EV(s) was compared to a regulatory limit, usually that of the ICNIRP. The majority of studies have focused on EMF emissions from EVs alone [2833, 3743, 51, 52]. Others studies have gone a step further and compared the emissions of EVs and other types of vehicles, such as hybrid EVs [2426, 35, 38, 44, 53] and conventional gasoline engine vehicles [27, 35]. However, certain parameters remain unaccounted for, and multiple regulatory bodies exist with varying limits.
Based on our literature review, we narrowed down our equipment of choice while keeping in mind the shortcomings in the overall research in this field. It was observed that some studies only recorded the DC EMF field generated. While all meters are certified by a competent authority, more recent meter(s) have some technological upgrades, such as data logging capability, temperature resistance, and a wider range of measurement. The data obtained established that both DC and AC EMFs are emitted during operation of the EV. The DC field levels were always higher than the AC field levels, as seen in Table 3. This might be due to the interaction of the AC field produced by the car components (for example, the inverter) and the earth’s natural DC field. We can infer that some of the AC fields may be superimposed, leading to higher DC levels.
Magnetic field levels increased with speed. Each field level showed a significant increase in value across each measurement position for the different operating conditions selected. Additionally, switching operating conditions resulted in a significant increase in the fields produced, with the highest values seen at the front passenger floor (DC field increased from 0.04 mG at rest to 4.8 mG at 40 km/hr).
A relationship between the DC to AC fields during different conditions was determined by means of correlation coefficient analysis. The results revealed that the fields are positively correlated when the EV is switched on (approximately 0.5 at idling and 0.8 at speeds of 40 km/hr and 80 km/hr). Thus, this implies that an increase in the DC magnetic field is accompanied by an increase in the AC magnetic field and vice versa. An increase in speed resulted in greater EMF generation.
The frequency spectrum for the fields produced in the EV fell within: 16.7 Hz, 50/60 Hz, 100/120 Hz, 150/180 Hz, R < 2 kHz and > 2 kHz. The greatest concern regarding EMF is the dominating frequency of the EV, as the other frequencies are usually negligible. The dominating frequency for the car at rest was 50/60 Hz, with < 2 kHz as the second dominating frequency. The only exception was at the driver’s foot region.
A frequency of 50 or 60 Hz is found in most household appliances [54]. However, during operation, the frequency of the EV changed from 50 or 60 Hz to < 2 kHz. The change in frequency was more predominant at the front of the EV (the front passenger and driver regions). We were unable to determine why different frequency distributions occurred at varying points.
The DC and AC values obtained were below most regulatory agencies’ safety limits except for the limit set by the Building Biology Standards [14] (2.01 mG). Table 3 shows that the AC meter recorded peak values for very strong fields. Although these fields were unsteady, they represented the highest values obtainable. Based on our sampling, these values were not constant but rather fluctuating, and they could not be obtained on repeated trials. It is reasonable to infer that this level is fleeting and unstable, thus making it not harmful.
Occupants sit close to a powerful electric system when riding in an EV. The field pattern revealed that the EMF emission levels increased when the car was on and in use. Additionally, the pattern revealed that the front seats had higher EMF levels than the rear seats, even at rest. In this study, the EV’s battery was situated beneath the vehicle.
Braking and acceleration during the road tests caused fluctuations in EMF values. As such, it can be deduced that acceleration and deceleration affect EMF levels. The EMF was observed to increase with increasing speed, which agrees with [25]. The peak values for the AC magnetic field were unpredictable and changed when the test was repeated; thus, the data cannot be interpreted with certainty.
A shortcoming of this study may be attributable to the limited sample size. Future studies should experiment with large sample sizes and more statistical tests, like analysis of variance, for comparison. Additionally, the combination of DC and AC fields may affect biological systems, but that is beyond the scope of this work. One study did infer that the combination of AC and DC fields coupled with their fluctuating levels might be harmful [55]. Future works should consider the effects of these weak fields on human subjects using physiological tests, such as heart rate variability, gaze technology, and galvanic skin response, while driving the EV.

V. Conclusion

Similar to other studies on EV EMF emissions, the values obtained in this study were below the ICNIRP and IEEE limits. In future studies, these values can be used to replicate the level generated by an EV to determine if it is harmful. This study established that both AC and DC fields were generated in the EV during operation (switching on and in motion) of the vehicle. The driver’s and front passenger’s feet region generated stronger EMF levels than any other location, at a frequency of 50/60 Hz, which is similar to that of home appliances [45, 54]. This study provides useful information on EMF intensity, frequency, field distribution, and conditions generated in the EV.

Fig. 1
High-speed road test route (speed at 80 km/hr; map extracted using kakaomap application, version 6.0).
jees-2021-4-r-35f1.jpg
Fig. 2
Low-speed road test route (speed at 40 km/hr; map extracted using kakaomap application, version 6.0).
jees-2021-4-r-35f2.jpg
Fig. 3
Measurement points. Adapted from [47].
jees-2021-4-r-35f3.jpg
Fig. 4
Measurement setup; collection point from Fig. 3.
jees-2021-4-r-35f4.jpg
Fig. 5
AC and AC peak relationship.
jees-2021-4-r-35f5.jpg
Fig. 6
Horizontal and vertical field distribution for the front and rear seat during rest (9D and 6D). Values are in mG. Dark green represents field levels similar to the earth natural field and brighter colors depict an increase in MF. The brighter the color, the stronger the MF intensity. Building biology standards are employed by the meter here.
jees-2021-4-r-35f6.jpg
Fig. 7
MF pattern at low speed (40 km/hr) for the front and rear seat during rest (6D). Values are in mG. Dark green represents field levels similar to the earth natural field and brighter colors depict an increase in MF. The brighter the color, the stronger the MF intensity. Building biology standards are employed by the meter here.
jees-2021-4-r-35f7.jpg
Fig. 8
MF sample point analysis using a bar chart.
jees-2021-4-r-35f8.jpg
Table 1
EV (IONIQ) specifications
Specification
EV type Powertrain
Engine Permanent magnet synchronous motor
Class All electric compact
Electric range 169 km (Korea)
Power Approximately 136 hp
Transmission Single speed reduction gear
Battery 28 kWh lithium-ion polymer battery

Source from [46].

Table 2
Data obtained at different conditions
Sample points Rest (mG) Idling (mG) 40 km/hr (mG) 80 km/hr (mG) Dominating freq. (Hz) 2nd dominating freq. (Hz)


DC AC AC peak DC AC AC peak DC AC AC peak DC AC AC peak At rest During motion At rest During motion
Motor 2.8 0.79 6.45 2.15 1.8 4 - - - - - - 50/60 - < 2,000 -
Trunk 2.73 0.1 0.7 1.2 0.11 0.33 1.9 0.33 5 1.22 1.19 5.89 50/60 50/60 < 2,000 < 2,000
Left rear head 1.34 0.09 0.42 0.97 0.22 0.58 1.96 0.5 4.2 1.77 1.1 16.13 50/60 < 2,000 < 2,000 50/60
Left rear chest 0.66 0.06 0.45 1.36 0.31 0.6 1.09 0.58 4.2 2.13 1.45 36 50/60 50/60 < 2,000 < 2,000
Left rear floor 6 0.06 0.24 6.76 1.42 2.6 4.99 1.8 8.79 6 6.45 0.145×10³ 50/60 50/60 < 2,000 < 2,000
Right rear head 1.39 0.07 0.24 1.2 0.14 0.54 0.8 1.5 5 1.61 4.79 30.7 50/60 50/50 150/180 150/180
Right rear chest 1.26 0.05 0.21 1.34 0.14 0.39 1.36 1.46 5.69 1.59 2 16.99 50/60 < 2,000 < 2,000 50/60
Right rear floor 5.8 0.06 0.24 7.33 0.48 0.91 6 2.4 6.75 5.45 6.7 0.142×10³ 50/60 50/60 < 2,000 < 2,000
Passenger head 1.93 0.07 0.25 0.63 0.17 0.6 1.1 0.26 3 1.9 0.66 30.1 50/60 50/60 < 2,000 150/180
Passenger chest 1.97 0.05 0.22 1.74 0.4 0.96 2.23 0.43 3.27 1.87 0.69 30.93 50/60 < 2,000 < 2,000 >2,000
Passenger floor 4.25 0.04 0.22 3.4 2.21 4.94 4.8 2.35 8.65 4.41 6.6 0.199×10³ 50/60 < 2,000 150/180 50/60
Driver head 1.96 0.09 0.25 0.99 0.18 0.51 1.27 0.28 2 2.05 0.39 9.3 50/60 < 2,000 < 2,000 50/60
Driver chest 1.39 0.07 0.28 1.4 0.33 0.78 1.45 0.53 5.93 1.84 0.91 40 50/60 < 2,000 < 2,000 150/180
Driver floor 3.98 0.09 0.4 3.6 1.53 3 3.2 2.02 8.82 3.03 8.1 0.111×10³ < 2,000 < 2,000 150/180 50/60

The dominating and second dominating frequency represents the highest first and second frequencies for MF detected.

Frequency detection is an added feature of the NAF meter. We measured MF at the AC band (16 to 2,000 Hz).

According to the meter manual, the NAF meter frequency-LEDs change their color in proportion to their contribution to the total field strength: 50/60 Hz, mains frequency. The bandwidth only covers individual frequencies of 50 Hz and 60 Hz with their respective lock-in ranges; 100/120 Hz, this LED indicates the contribution of the second through fourth “even” harmonics; 150/180 Hz, this LED indicates the contribution of the third through fourth “uneven” harmonics. The third harmonics will presently be found in many homes and most offices as a significant portion of the total measurement; and < 2 kHz, means remainder of frequencies below 2 kHz.

Source of the magnetic field are attributed to the motor speed.

Table 3
Correlations analysis of DC to AC across conditions
DC/AC value
Rest 0.006
Idling 0.475
40 km/hr 0.770
80 km/hr 0.756
Table 4
EMF meter specifications
FW BELL 5170 [46] Combinova MFM10 [48] EMDEX II [49] EMDEX Lite [49] Narda EHP-50D [50] Narda EFA-200 [50]
Accuracy 2% ±1% of reading
±0.003 μT
- - - -
Frequency 20 kHz (DC) 5–2,000 Hz 40–1,000 Hz 40–1,000 Hz 1–400 kHz 20 mT (at 50 Hz)
Sampling rate (s) 5 - 1.5 4 - -
Range 200–20 KG 0.01–10,000 μT 3 Gauss 0.7 Gauss 0.3 nT to 10 mT -
Measurement unit G, T, k/Am μT μT μT nT, mT nT, mT
Operating temperature (°C) 0 to 50 −20 to 50 - - −20 to 55 −20 to 23
Data logging - Up to 4,000 result 20 data set 1 data set Yes Yes
Price $1,482.86 $1,350.00 $3,000.00 $1,135.00 €5,769.20 Approx. €7,500.00

References

1. NG Ptitsyna, A Ponzetto, YA Kopytenko, VS Ismagilov, and AG Korobeinikov, "Electric vehicle magnetic fields and their biological relevance," Journal of Scientific Research and Reports, vol. 3, pp. 1753–1770, 2014.
crossref
2. WEEP News. Fear but few facts, on hybrid risk, 2008. Available: http://weepnews.blogspot.com/search?q=fear-but-few-facts-on-hybrid

3. N Irvine, Definition, epidemiology and management of electrical sensitivity. Health Protection Agency, Oxfordshire, UK: Report No HPA-RPD-010, 2005.

4. GJ Rubin, JD Munshi, and S Wessely, "Electromagnetic hypersensitivity: a systematic review of provocation studies," Psychosomatic Medicine, vol. 67, no. 2, pp. 224–232, 2005.
crossref pmid
5. JY Yong, VK Ramachandaramurthy, KM Tan, and N Mithulananthan, "A review on the state-of-the-art technologies of electric vehicle, its impacts and prospects," Renewable and Sustainable Energy Reviews, vol. 49, pp. 365–385, 2015.
crossref
6. F Un-Noor, S Padmanaban, L Mihet-Popa, MN Mollah, and E Hossain, "A comprehensive study of key electric vehicle (EV) components, technologies, challenges, impacts, and future direction of development," Energies, vol. 10, no. 8, article no 1217, 2017. https://doi.org/10.3390/en10081217
crossref
7. M Wolsink, "The research agenda on social acceptance of distributed generation in smart grids: renewable as common pool resources," Renewable and Sustainable Energy Reviews, vol. 16, no. 1, pp. 822–835, 2012.
crossref
8. UN Framework Convention on Climate Change. Adoption of the Paris Agreement, 2015. [Online]. Available: https://unfccc.int/resource/docs/2015/cop21/eng/l09r01.pdf

9. International Commission on Non-Ionizing Radiation Protection. "Guidelines for limiting exposure to time-varying electric, magnetic, and electromagnetic fields (up to 300 GHz)," Health Physics, vol. 74, no. 4, pp. 494–522, 1998.
pmid
10. International Commission on Non-Ionizing Radiation Protection. "Guidelines for limiting exposure to time-varying electric and magnetic fields (1 Hz to 100 kHz)," Health Physics, vol. 99, no. 6, pp. 818–836, 2010.
crossref pmid
11. JC Lin, "A new IEEE standard for safety levels with respect to human exposure to radio-frequency radiation," IEEE Antennas and Propagation Magazine, vol. 48, no. 1, pp. 157–159, 2006.
crossref
12. A Fragopoulou, Y Grigoriev, O Johansson, LH Margaritis, L Morgan, E Richter, and C Sage, "Scientific panel on electromagnetic field health risks: consensus points, recommendations, and rationales," Reviews on Environmental Health, vol. 25, no. 4, pp. 307–317, 2010.
pmid
13. G Hyland, The Physiological and Environmental Effects on Non-ionising Electromagnetic Radiation. Luxembourg: European Parliament, Directorate General for Research, 2001.

14. Institut für Baubiologie + Nachhaltigkeit (IBN). Building biology evaluation guidelines for sleeping areas, 2008. [Online]. Available: https://www.baubiologie.de/downloads/english/richtwerte_2008_englisch.pdf

15. AVAATE. Guideline of the Austrian Medical Association for the diagnosis and treatment of EMF-related health problems and illnesses (EMF syndrome): consensus paper of the Austrian Medical Association’s EMF Working Group (AG-EMF), 2012. Available: https://avaate.org/spip.php?article2279

16. SJ Starkey, "Inaccurate official assessment of radiofrequency safety by the Advisory Group on Non-ionising Radiation," Reviews on Environmental Health, vol. 31, no. 4, pp. 493–503, 2016.
crossref pmid
17. BioInitiative. BioInitiative 2012 a rationale for biologically-based exposure standards for low-intensity electromagnetic radiation, 2012. Available: https://bioinitiative.org/conclusions/

18. J Podd, J Abbott, N Kazantzis, and A Rowland, "Brief exposure to a 50 Hz, 100 μT magnetic field: effects on reaction time, accuracy, and recognition memory," Bioelectromagnetics, vol. 23, no. 3, pp. 189–195, 2002.
crossref pmid
19. CL Mitchell, DI McRee, NJ Peterson, and HA Tilson, "Some behavioral effects of short-term exposure of rats to 2.45 GHz microwave radiation," Bioelectromagnetics, vol. 9, no. 3, pp. 259–268, 1988.
crossref pmid
20. N Leitgeb and J Schrottner, "Electrosensibility and electromagnetic hypersensitivity," Bioelectromagnetics, vol. 24, no. 6, pp. 387–394, 2003.
crossref pmid
21. M Crasson, JJ Legros, P Scarpa, and W Legros, "50 Hz magnetic field exposure influence on human performance and psychophysiological parameters: Two double-blind experimental studies," Bioelectromagnetics, vol. 20, no. 8, pp. 474–486, 1999.
crossref pmid
22. A Barth, I Ponocny, E Ponocny-Seliger, N Vana, and R Winker, "Effects of extremely low-frequency magnetic field exposure on cognitive functions: results of a metaanalysis," Bioelectromagnetics, vol. 31, no. 3, pp. 173–179, 2010.
crossref pmid
23. JP Reilly, "Maximum pulsed electromagnetic field limits based on peripheral nerve stimulation: application to IEEE/ANSI C95. 1 electromagnetic field standards," IEEE Transactions on Biomedical Engineering, vol. 45, no. 1, pp. 137–141, 1998.
crossref pmid
24. RA Tell, G Sias, J Smith, J Sahl, and R Kavet, "ELF magnetic fields in electric and gasoline-powered vehicles," Bioelectromagnetics, vol. 34, no. 2, pp. 156–161, 2013.
crossref pmid
25. R Hareuveny, M Sudan, MN Halgamuge, Y Yaffe, Y Tzabari, D Namir, and L Kheifets, "Characterization of extremely low frequency magnetic fields from diesel, gasoline and hybrid cars under controlled conditions," International Journal of Environmental Research and Public Health, vol. 12, no. 2, pp. 1651–1666, 2015.
crossref pmid pmc
26. MN Halgamuge, CD Abeyrathne, and P Mendis, "Measurement and analysis of electromagnetic fields from trams, trains and hybrid cars," Radiation Protection Dosimetry, vol. 141, no. 3, pp. 255–268, 2010.
crossref pmid
27. A Vassilev, A Ferber, C Wehrmann, O Pinaud, M Schilling, and AR Ruddle, "Magnetic field exposure assessment in electric vehicles," IEEE Transactions on Electromagnetic Compatibility, vol. 57, no. 1, pp. 35–43, 2015.
crossref
28. K Vedholm and YK Hamnerius, "Personal exposure resulting from low level low frequency electromagnetic fields in automobiles," In: Proceedings of the 2nd World Congress for Electricity and Magnetism in Medicine and Biology; Bologna, Italy. 1997, pp 8–13.

29. S Stankowski, A Kessi, O Becheiraz, K Meier-Engel, and M Meier, "Low frequency magnetic fields induced by car tire magnetization," Health Physics, vol. 90, no. 2, pp. 148–153, 2006.
crossref pmid
30. P Moreno-Torres, M Lafoz, M Blanco, and JR Arribas, "Passenger exposure to magnetic fields in electric vehicles," In: Modeling and Simulation for Electric Vehicle Applications; Rijeka, Croatia: InTech. 2016, pp 47–71.
crossref
31. PC Moreno-Torres, J Lourd, M Lafoz, and JR Arribas, "Evaluation of the magnetic field generated by the inverter of an electric vehicle," IEEE Transactions on Magnetics, vol. 49, no. 2, pp. 837–844, 2013.
crossref
32. T Campi, S Cruciani, V De Santis, F Maradei, and M Feliziani, "Numerical characterization of the magnetic field in electric vehicles equipped with a WPT system," Wireless Power Transfer, vol. 4, no. 2, pp. 78–87, 2017.
crossref
33. C Lennerz, M O’Connor, L Horlbeck, J Michel, S Weigand, C Grebmer et al., "Electric cars and electromagnetic interference with cardiac implantable electronic devices: a cross-sectional evaluation," Annals of Internal Medicine, vol. 169, no. 5, pp. 350–352, 2018.
crossref pmid
34. AR Ruddle, R Armstrong, L Dawson, and A Rowell, "Investigation of human exposure to magnetic fields from electrical powertrains: measured exposure levels and simulated impact on human body," In: Proceedings of the 5th IET Hybrid and Electric Vehicles Conference (HEVC); London, UK. 2014.
crossref
35. S Milham, JB Hatfield, and R Tell, "Magnetic fields from steel-belted radial tires: implications for epidemiologic studies," Bioelectromagnetics, vol. 20, no. 7, pp. 440–445, 1999.
crossref pmid
36. AR Ruddle and L Low, Assessing low frequency magnetic field exposure in hybrid and electric vehicles, 2014. [Online]. Available: https://interferencetechnology.com/assessing-low-frequency-magnetic-field-exposure-in-hybrid-and-electric-vehicles/

37. AM Muc, Electromagnetic Fields Associated with Transportation Systems. Toronto, Canada: Radiation Health and Safety Consulting, 2001.

38. E Karabetsos, E Kalampaliki, and D Koutounidis, "Testing hybrid technology cars: static and extremely low-frequency magnetic field measurements," IEEE Vehicular Technology Magazine, vol. 9, no. 4, pp. 34–39, 2014.
crossref
39. FM Dietrich and WL Jacobs, Survey and assessment of electric and magnetic field (EMF) public exposure in the transportation environment. Electric Research and Management Inc, State College, PA: No. PB-99-130908/XAB, 1999.

40. G Schmid, R Uberbacher, and P Goth, "ELF and LF magnetic field exposure in hybrid-and electric cars," In: Proceedings of the Bio-electromagnetics Conference; 2009, Davos, Switzerland.

41. H Kato, C Ohkubo, and K Isaka, "Measurement of the magnetic fields in cars running at constant speeds," In: Proceedings of the Joint Meeting of the Bioelectromagnetics Society and the European Bio Electromagnetics Association (BioEM); Thessaloniki, Greece. 2013, pp 10–14.

42. E Karabetsos, E Kalampaliki, G Tsanidis, D Koutounidis, N Skamnakis, T Kyritsi, and A Yalofas, "EMF measurements in hybrid technology cars," In: Proceedings of 6th International Workshop on Biological Effects of Electromagnetic Fields; Istanbul, Turkey. 2010, pp 10–14.

43. M Snyder, Magnetic shielding for electric vehicles, 1995. [Online]. Available: http://www.engineeringmatters.com/Magnetic%20Shielding%20for%20Electric%20Vehicles.pdf

44. NG Ptitsyna, A Ponzetto, YA Kopytenko, VS Ismagilov, and AG Korobeinikov, "Electric vehicle magnetic fields and their biological relevance," Journal of Scientific Research and Reports, vol. 3, no. 13, pp. 1753–1770, 2014.
crossref
45. FS Barnes and B Greenebaum, Biological and Medical Aspects of Electromagnetic Fields. Boca Raton, FL: CRC Press, 2018.

46. Hyundai Motors. IONIQ electric highlights, 2020. [Online]. Available: https://www.hyundai.com/worldwide/en/eco/ioniq-electric/highlights

47. VectorStock. Electric vehicle vector images (over 19,000), 2021. Available: https://www.vectorstock.com/royalty-free-vectors/electric-vehicle-vectors

48. Combinova. Magnetic Field Meter 10 operator manual. Available: http://manuals.repeater-builder.com/te-files/MISCELLANEOUS/COMBINOVA%20MFM10%20Operator.pdf

49. EMDEX II Recording Meters. [Online]. Available: https://emdex-llc.com/meter-sales/

50. NARDA. User’s manual EHP-50F, 2015. Available: https://www.manualslib.com/manual/1396879/Narda-Ehp-50f.html

51. MN Halgamuge, CD Abeyrathne, and P Mendis, "Influence of combined AC–DC electromagnetic fields on cell plasma membrane," In: Proceedings of BEMS/EBEA 2009 Joint Meeting; Davos, Switzerland. 2009.

52. AR Ruddle, L Low, and A Vassilev, "Evaluating low frequency magnetic field exposure from traction current transients in electric vehicles," In: Proceedings of 2013 International Symposium on Electromagnetic Compatibility; Brugge, Belgium. 2013, pp 78–83.

53. G Shenhar and G Hard, Mythbuster EMF levels in hybrids, 2010. Available: https://www.consumerreports.org/cro/news/2010/08/mythbuster-emf-levels-in-hybrids/index.htm

54. S Aerts, C Calderon, B Valic, M Maslanyj, D Addison, T Mee et al., "Measurements of intermediate-frequency electric and magnetic fields in households," Environmental Research, vol. 154, pp. 160–170, 2017.
crossref pmid
55. A Sastre, MR Cook, and C Graham, "Nocturnal exposure to intermittent 60 Hz magnetic fields alters human cardiac rhythm," Bioelectromagnetics, vol. 19, no. 2, pp. 98–106, 1998.
crossref pmid

Biography

jees-2021-4-r-35i1.jpg
Nelson A. Enegbuma has a B.Sc. in physics from the University of Jos, Nigeria and an M.Sc. in chemical engineering with a major in integrated chemical and environmental technologies from Hankyong National University, South Korea. He currently works as a Principal Scientific Officer at the Abuja Environmental Protection Board in Nigeria.

Biography

jees-2021-4-r-35i2.jpg
Soochan Kim currently works for the Department of Electronic and Electrical Engineering at the Research Center for Applied Human Sciences, Hankyong National University in South Korea. His areas of interest include bio signal measurement and instrumentation, human–computer interfaces, human magnetic sensitivity, and non-intrusive human fatigue estimation.
TOOLS
Share :
Facebook Twitter Linked In Google+
METRICS Graph View
  • 1 Crossref
  • 0 Scopus
  • 3,487 View
  • 94 Download
Related articles in JEES

ABOUT
ARTICLE CATEGORY

Browse all articles >

BROWSE ARTICLES
AUTHOR INFORMATION
Editorial Office
#706 Totoo Valley, 217 Saechang-ro, Yongsan-gu, Seoul 04376, Korea
Tel: +82-2-337-9666    Fax: +82-2-6390-7550    E-mail: admin-jees@kiees.or.kr                

Copyright © 2024 by The Korean Institute of Electromagnetic Engineering and Science.

Developed in M2PI

Close layer
prev next