Comparison of 0.75–24-GHz Reach Distances and Ratios Using Propagation Path Loss Measurements from Urban and Rural Line-of-Sight Environments
Article information
Abstract
In this paper, we present experimental transmittance data at 0.75, 1, 2, 3, 4.5, 6, 10, 18, and 24 GHz from urban and rural environments. All measurements were performed under line-of-sight (LoS) conditions. Reach distances were extracted using the multifrequency alpha-beta-gamma model. Normalized individual and combined ratios were plotted against the frequencies and compared between the two environments. Although our data were obtained under LoS conditions, they can be used to predict the service area over a wide frequency range and establish a public policy for mobile communications.
I. Introduction
When a new commercial wireless service is launched, the government in general requires payment for the use of a frequency band. In principle, the cost is proportional to service coverage. High-frequency waves travel shorter distances than low-frequency waves; therefore, the use of the latter requires many more base stations. Thus, high-frequency bands are less economical than low-frequency bands. For example, the 1-GHz band costs US$1 million, and the 6-GHz band costs US$0.2 million more than the 1-GHz band. Thus, high-frequency bands are less economonical than low-frequency bands. On the other hand, the cost should be based on the service area. When estimating costs, wave propagation is considered when setting the administrative incentive price in the UK [1, 2] and the wave factor price in Korea [3], but these also reflect other costs, such as the number of users and network installation.
Commercialization of fifth-generation (5G) cellular technology is underway, and many research groups are already working on 6G. The service area ranges will be less than 1 km in both urban and rural areas, and the frequencies will be higher than 3 GHz. When comparing reach distances, it is possible to use a conventional propagation model [4–6]. However, limitations include the effective range and frequencies. The Okumura, Hata, Modified Hata, and COST-231 Hata models can be employed if the range exceeds 1 km [4–6]. The COST-231 Walfisch Ikegami model involves a limited frequency range, from 800 MHz to 2 GHz [4–6]. Recently, predictive models for urban street canyons have evaluated frequencies of 0.8, 2.2, 4.7, 8.4, 26.3, and 37 GHz [7]. However, no data have been obtained for frequencies of 6 to 24 GHz. In 2017, a wide-frequency-range site-general model for propagation in street canyons was established by ITU-R Recommendation P.1411–9 [8], but the data were collected at different sites under various conditions.
The delay spread is crucial for the communication service [9]. However, the system measuring the delay spread is exceedingly expensive in such broad bands. This issue may be investigated in a future study.
The service area depends on the type of digital modulation used [4], the channel configuration (e.g., multiple-input and multiple-output) [4, 10], and geographical features, such as buildings and trees.
In this study, we explored propagation reach distances and their ratios at 0.75, 1, 2, 3, 4.5, 6, 10, 18, and 24 GHz. The transmitter (Tx) height was 10 m, and the receiver (Rx) height was 1.5 m for the urban environment or 2.0 m for rural environment. To our knowledge, these conditions have not been tested previously. To precisely determine the ratios, we obtained measurements in both urban and rural environments. Instead of the alpha-beta (AB) model for a single frequency [11], the multifrequency alpha-beta-gamma (ABG) model [12] was used and compared to that of the propagation model recommended by ITU-R Recommendation P.1411–9.
The purpose of this study was to provide a basis for frequency usage. For this reason, we investigated reach distances based on continuous-wave (CW) line-of-sight (LoS) models, as they are appropriate for eliminating all additional effects. The LoS reach distance was defined as the distance associated with a path loss of 95 dB because the minimum received power is usually −85 dB for the 3GPP TS 36.521-1 protocol [13], assuming an antenna gain of 0 dBi and transmitter power of +10 dBm.
II. Propagation Environments
1. Urban Environment
We conducted path loss measurements in urban and rural environments. Fig. 1(a) shows an urban high-rise environment in the Sangmu District of Gwangju City, Korea. Many buildings are 5–10 stories high. There are also many roadside trees, street-lamps, vehicles, and pedestrians. The average street width is 20 m.
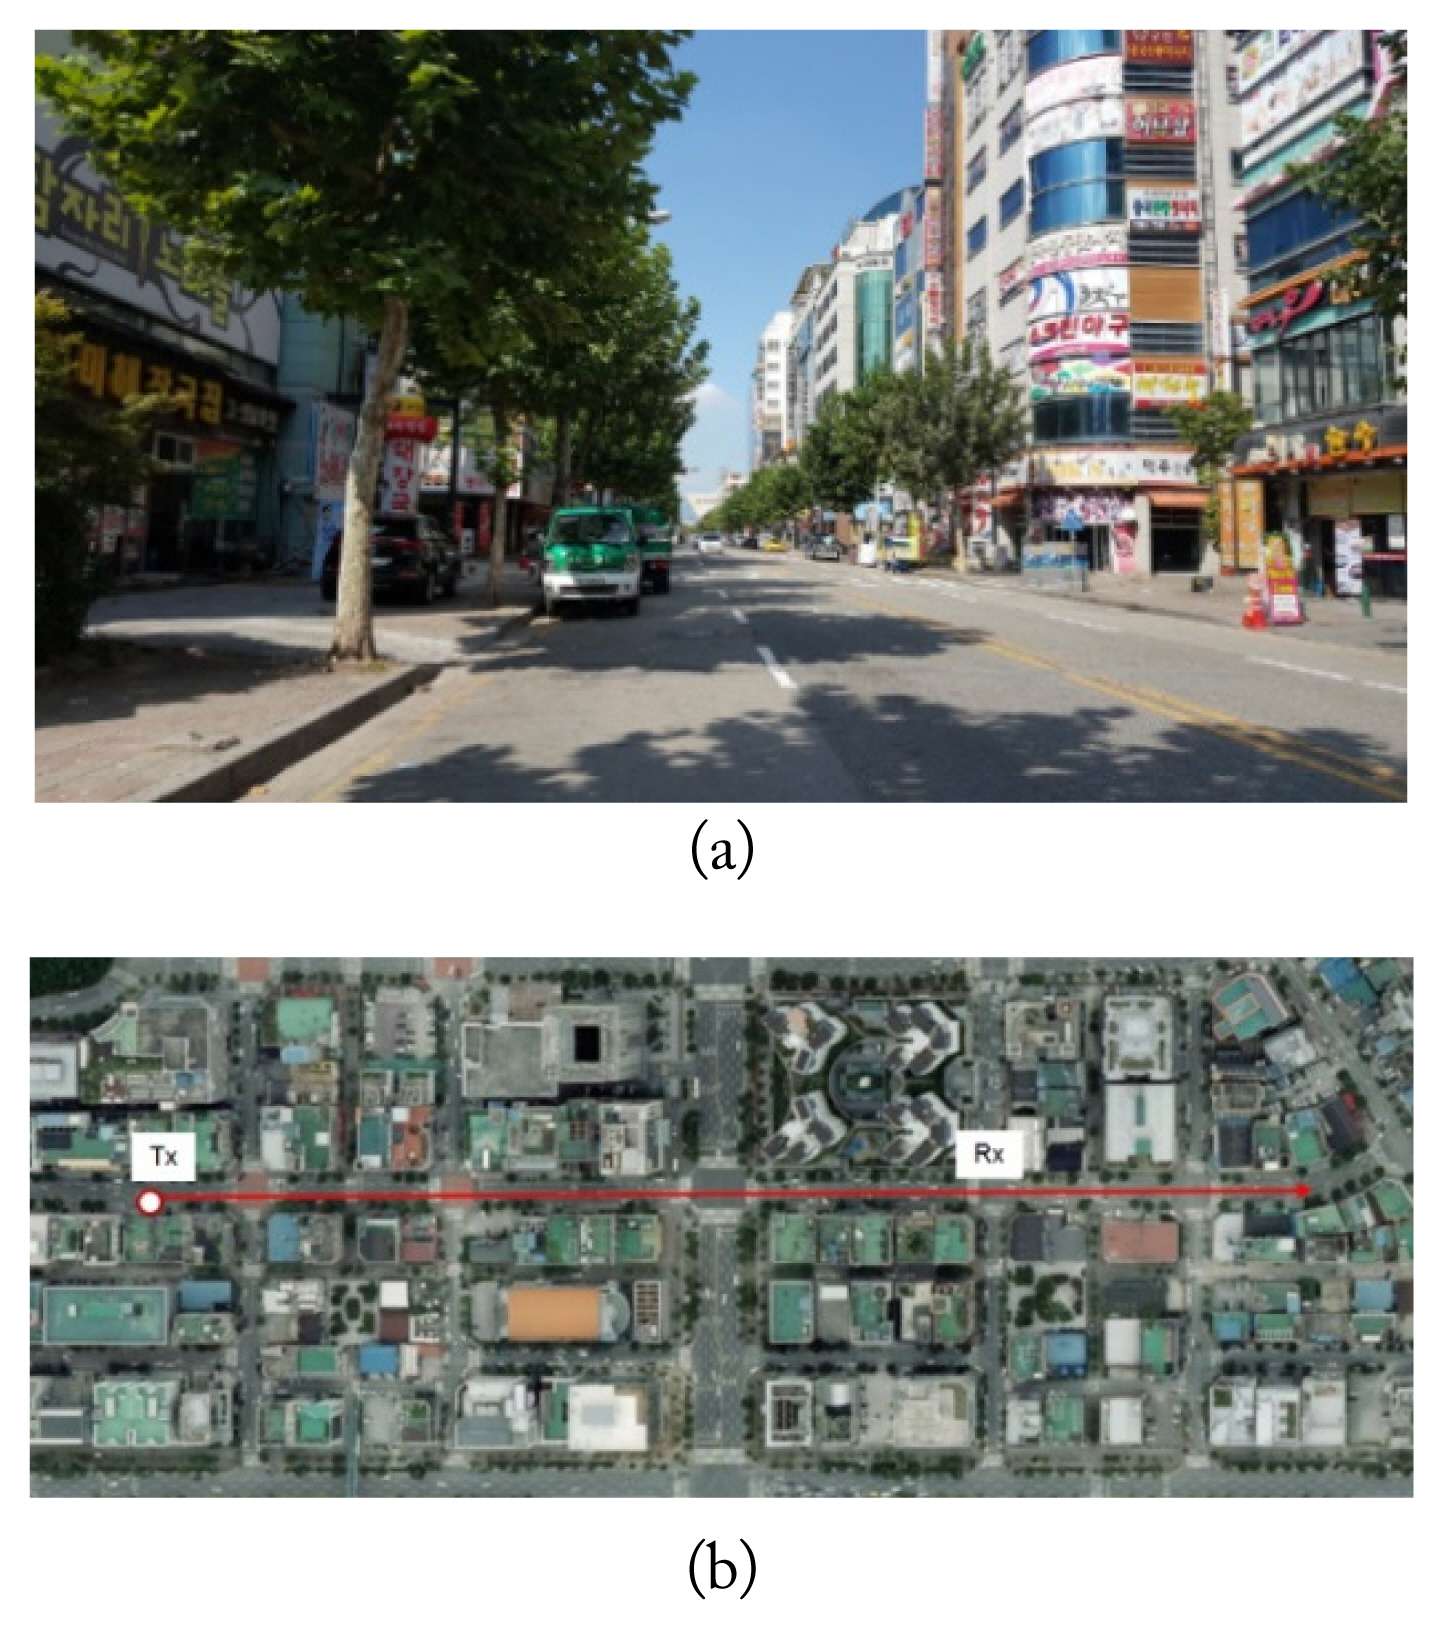
An urban high-rise environment (Gwangju, Korea): (a) street view and (b) the transmitter’s position (white circle) and the receiver’s path (red line).
Fig. 1(b) shows the Tx and Rx positions. All positions were acquired using the global positioning system (GPS). Each LoS distance exceeded 400 m. We collected at least 120 data points at each frequency. To moderate the fast-fading effect, we collected at least 15 consecutive data points at each Rx position and calculated the median value.
The Tx antenna was installed at the end of a bent support on top of a Tx vehicle, as shown in Fig. 2(a). The vehicle remained in the same position during all measurements. The Rx antenna was installed on top of a trolley, as shown in Fig. 2(b). The Tx and Rx antenna heights were 10 m and 1.5 m, respectively.
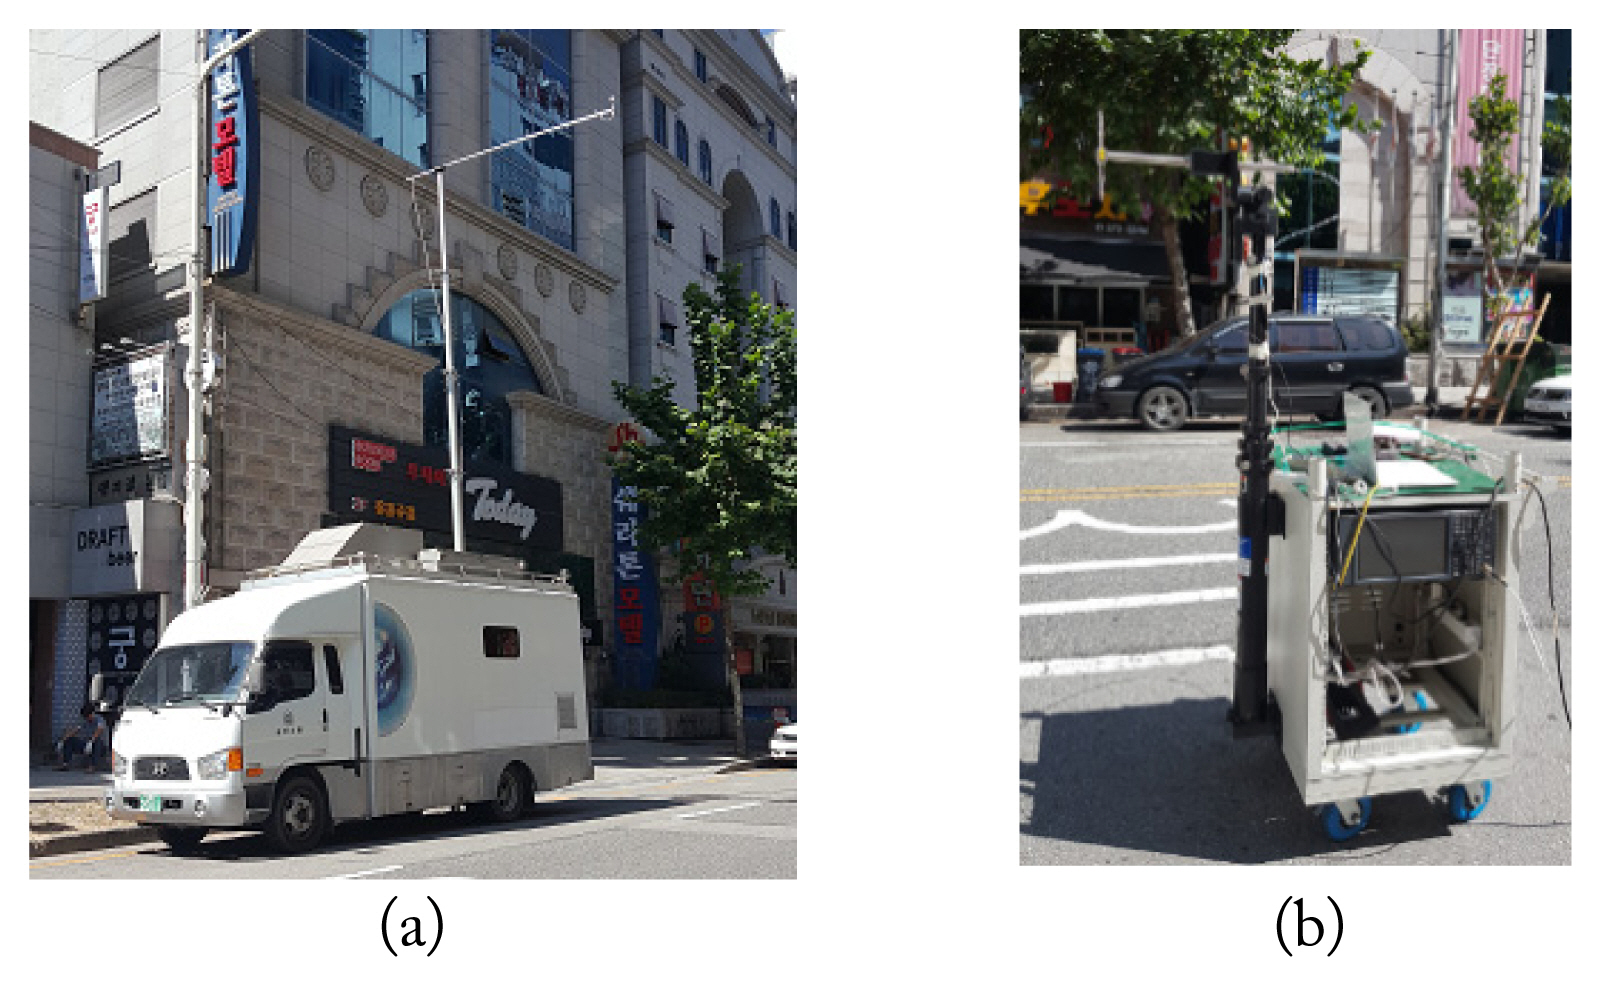
Measurement system: (a) transmitting vehicle and antenna and (b) receiving trolley and antenna.
The specifications of the measurement system used in the urban environment are listed in Table 1. The frequencies studied were 0.75, 1, 2, 3, 4.5, 6, 10, 18, and 24 GHz. We created un-modulated continuous waves of constant frequency and amplitude. The Tx power was 0 or 10 dBm, depending on whether an amplifier was used. A low noise floor (below −100 dB) was achieved using a spectrum analyzer with a narrow frequency span and a narrow bandwidth resolution. The specifications of the antennas used for the measurements are also displayed in Table 1. The UHA-series instrument was of the dipole type. The POD- and BIC-series devices were of the biconical type. The CMA was of the conical monopole type. All components were omnidirectional in the horizontal plane. The path loss was calculated as
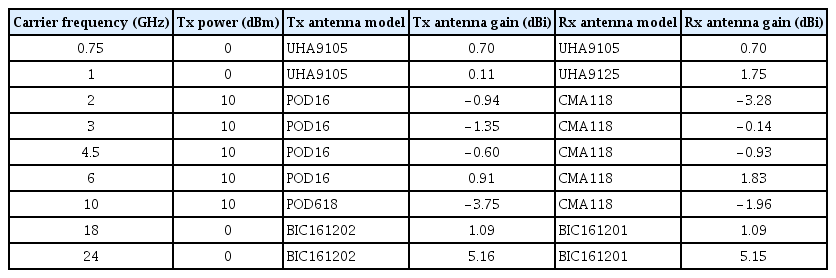
Measurement system for the urban environment (Gwangju, Korea)
where PTx is the transmitted power, PRx is the received power, GTx and GRx are the antenna gain of the transmitter and receiver, respectively, Gamp is the summed gain of the power amplifier and low-noise amplifier, and Lcable is the summed cable loss in the transmitting and receiving system.
2. Rural Environment
Fig. 3(a) shows a rural environment in Naju City, Korea. This district has a few buildings one or two stories high, many roadside trees, and street-lamps. There are few vehicles and pedestrians. The average street width is 26 m.

A rural environment (Naju, Korea): (a) street view and (b) the transmitter’s position (white circle) and the receiver’s path (red line).
Fig. 3(b) shows the Tx position and Rx path. Each LoS receiving position was more than 700 m distant from the Tx location. The Rx antenna was installed on top of a vehicle. The Tx and Rx antenna heights were 10 m and 2 m, respectively. The data received by the Rx antenna were collected along with GPS data as the Rx vehicle moved along the path shown in Fig. 3(b). The specifications of the system used for the rural environment are displayed in Table 2.

Measurement system for the rural environment (Naju, Korea)
III. Results
1. Measured Results
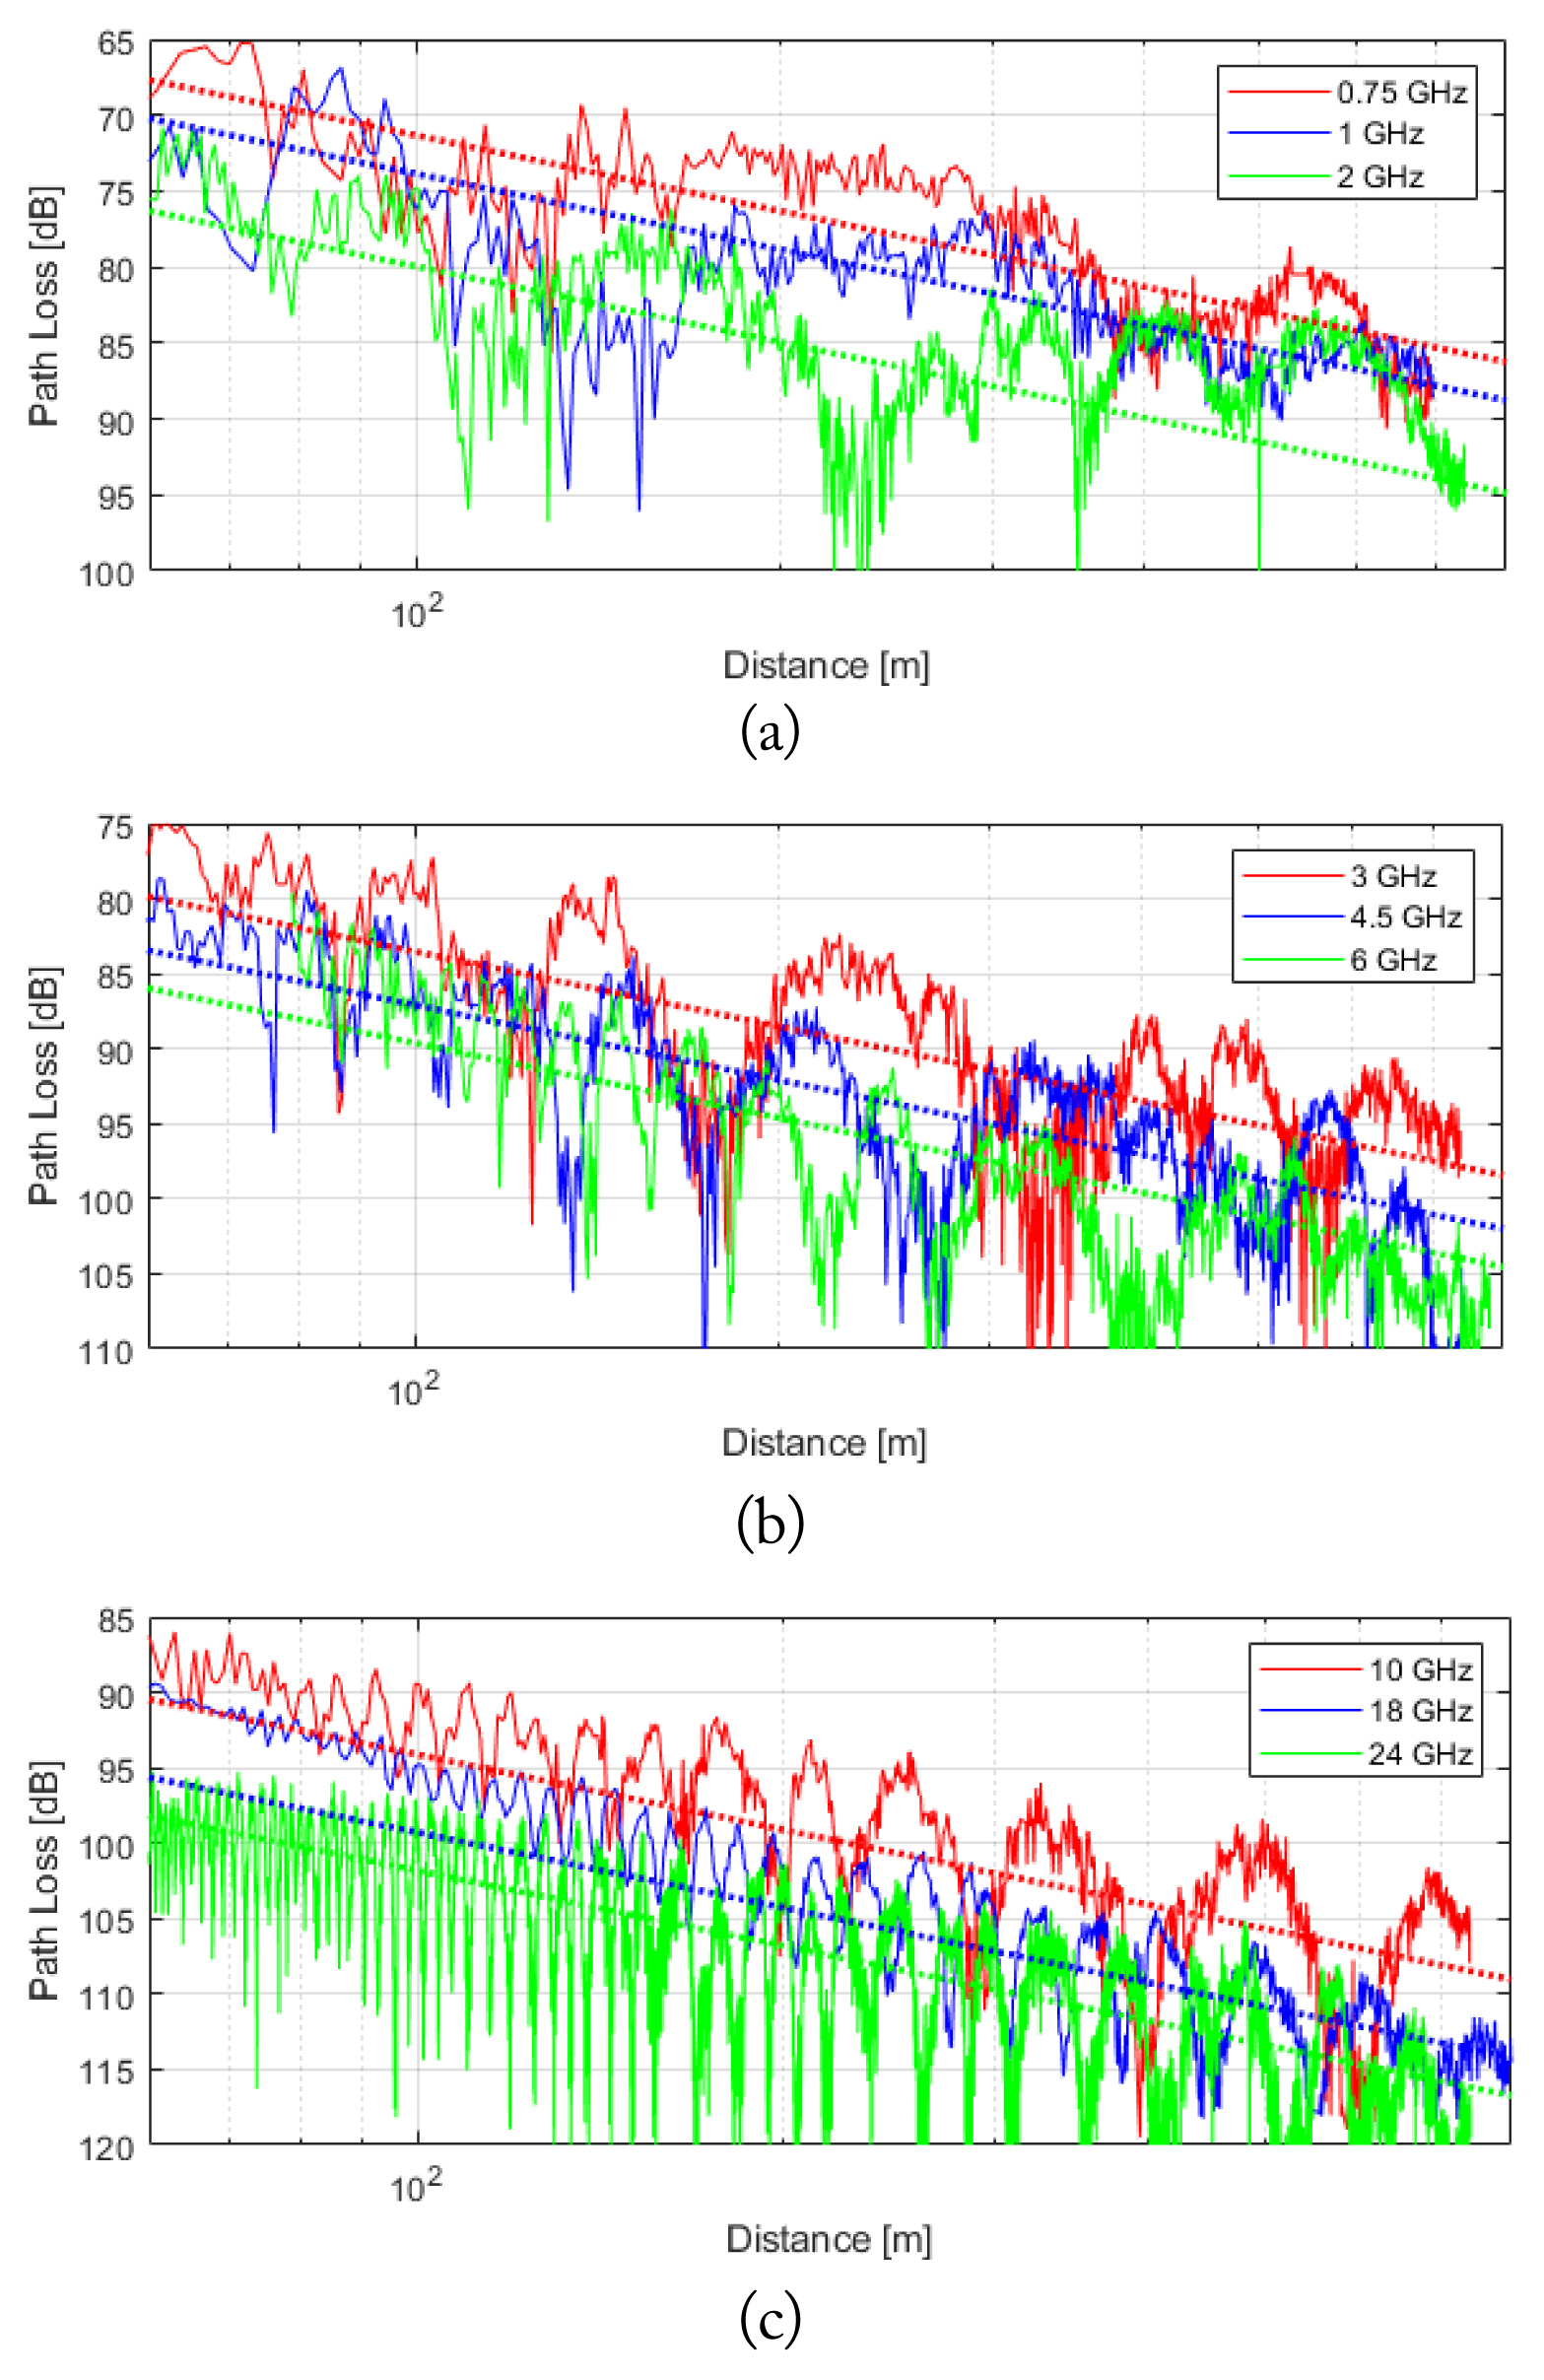
Fig. 4 shows the path losses in the urban environment of Gwangju (see Section II-1) using Eq. (1) from the measured receiver power PRx. Three plots were drawn with three frequency band groups for clarity. As shown in Fig. 4(a)–(c), the measured path loss curves contain many null points because of the fading effect. To determine the appropriate reach distances at 95 dB of path loss, smooth curves were extracted from the measured data as follows.
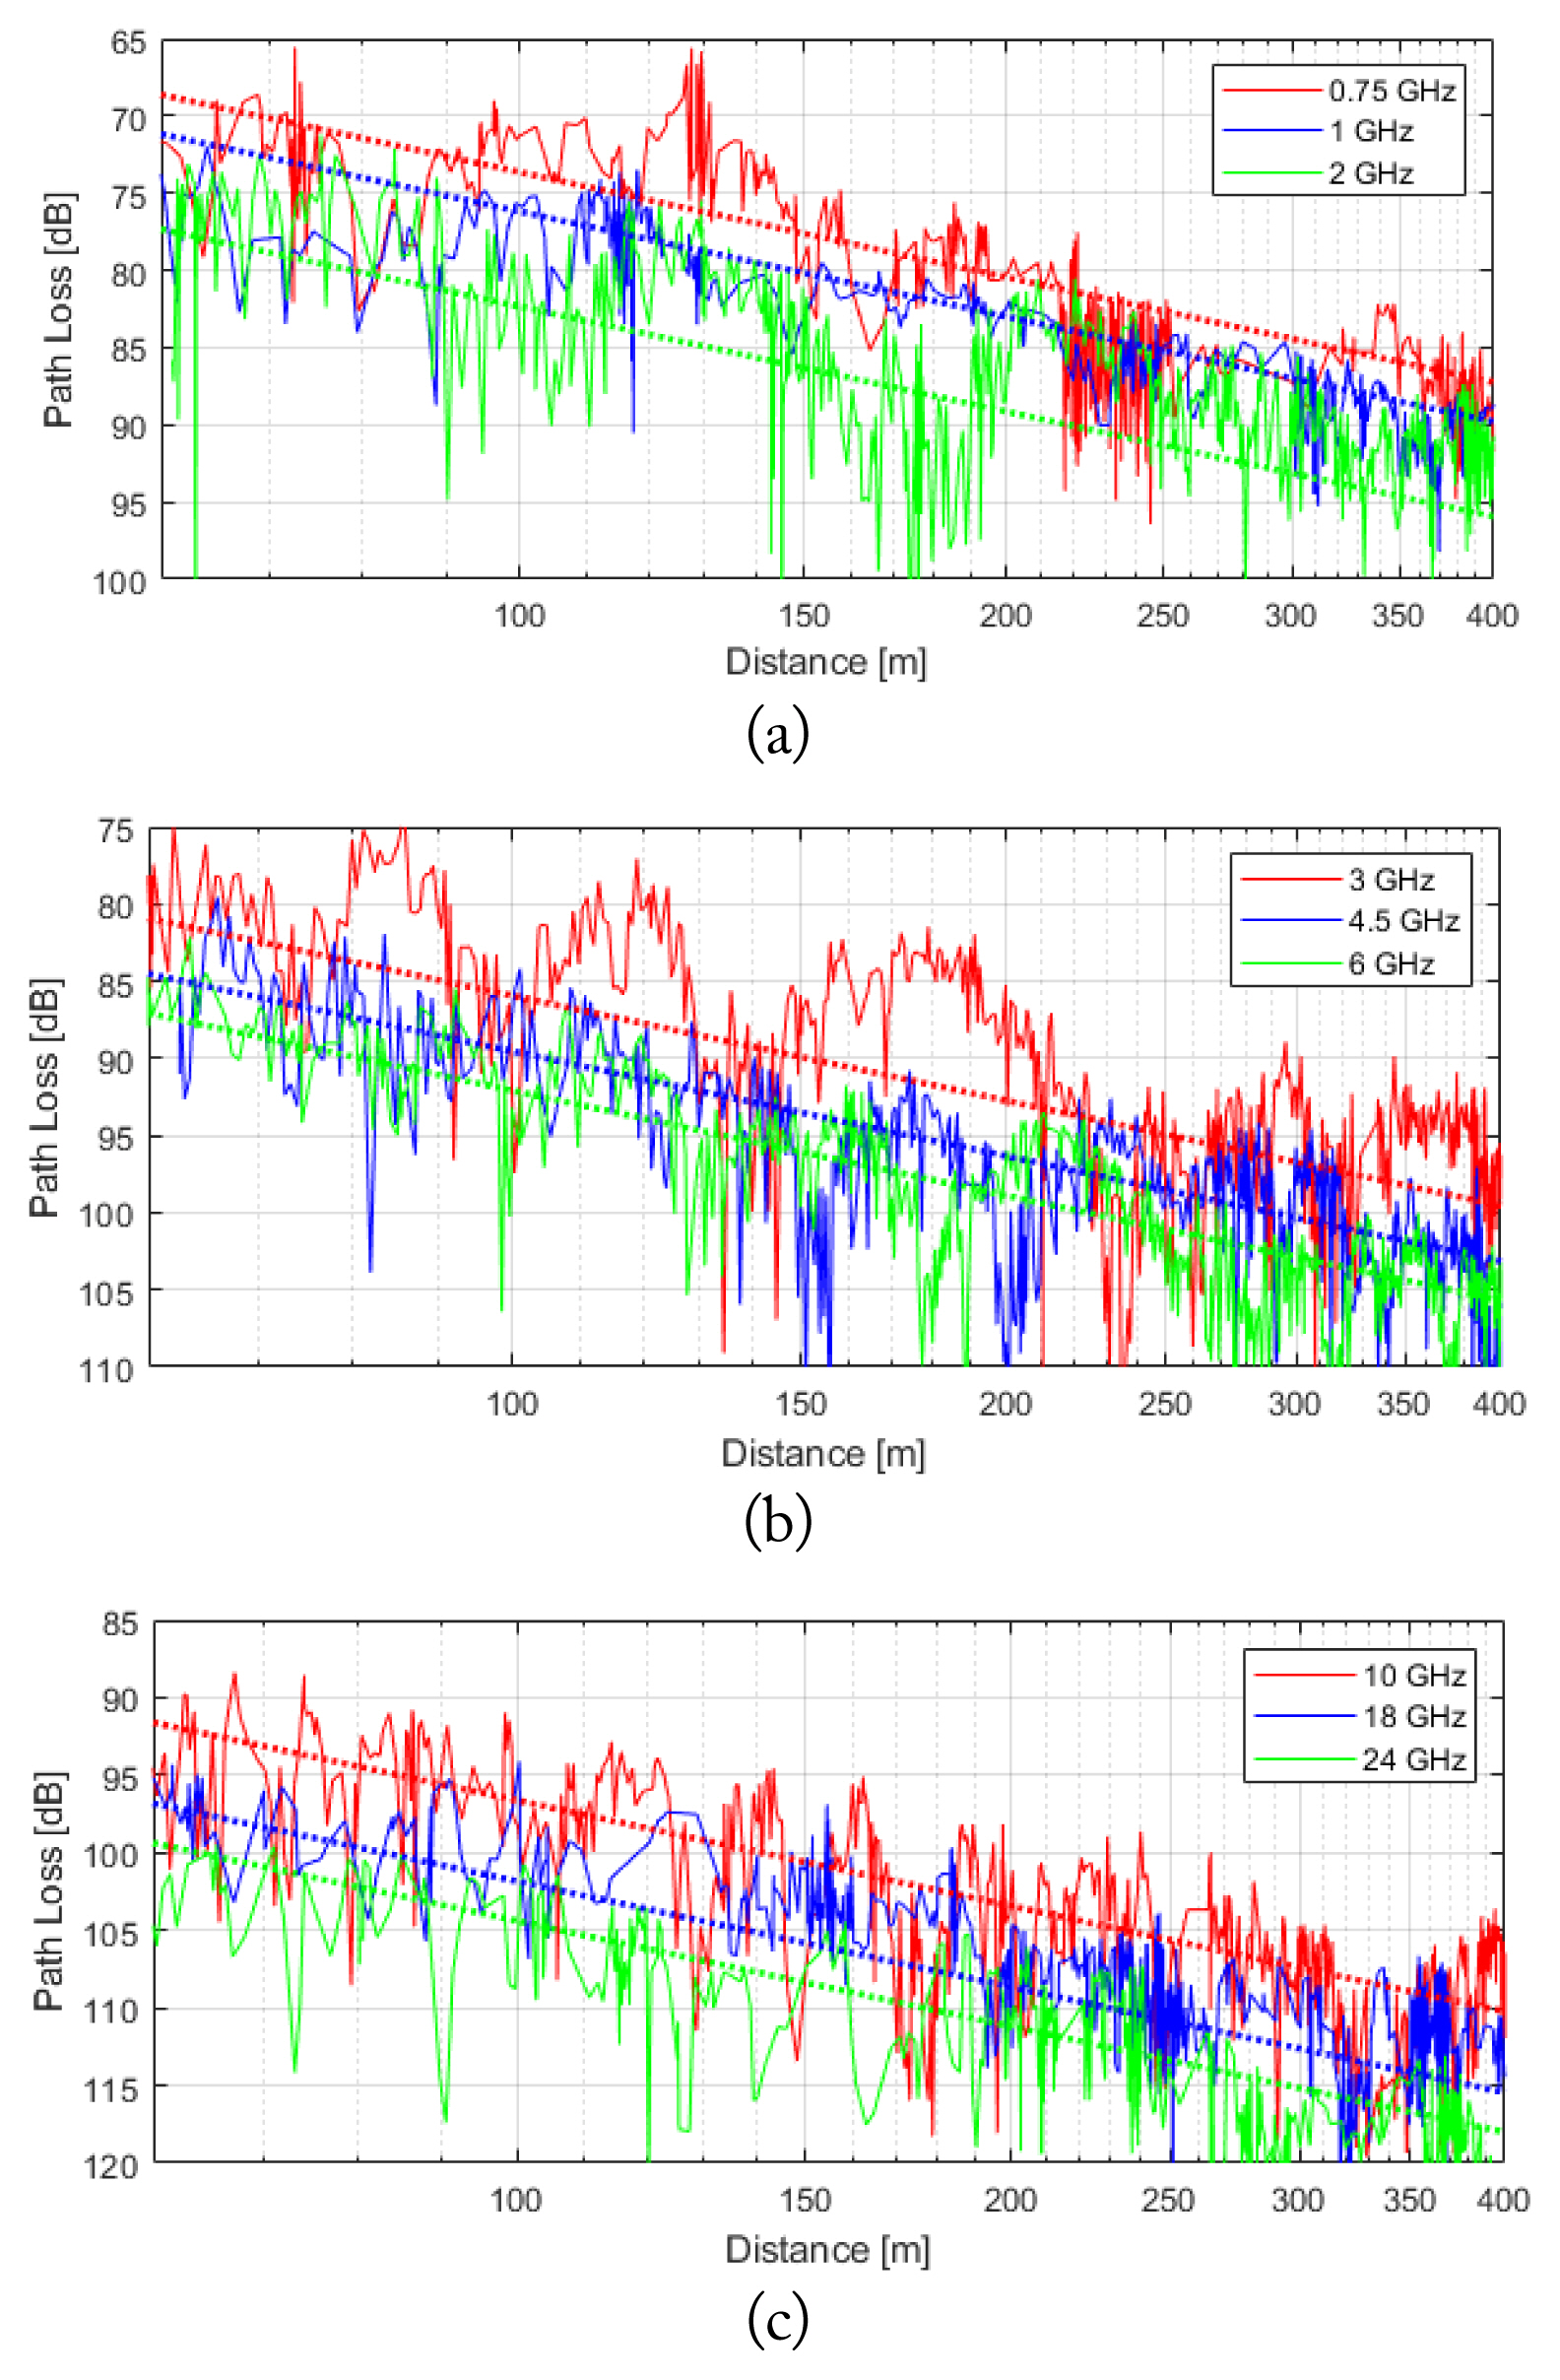
Measured and curve-fitted path losses derived using the ABG model in the urban environment (Gwangju) at (a) 0.75, 1, and 2 GHz, (b) 3, 4.5, and 6 GHz, and (c) 10, 18, and 24 GHz.
First, the equation for the ABG model given by [12] was used:
where L is the path loss, α is the slope coefficient by distance, β is the floating offset value of the path loss, γ is the difference coefficient by frequency, Xσ is the log-normal shadow fading factor, and σ is the standard deviation of shadow fading. The distance d and frequency f are expressed in meters and gigahertz, respectively. Here, the parameter α is not related to the frequency. Therefore, all fitted curves from the ABG model have the same slope, as shown in Fig. 4(a)–(c). With the AB model, the slope of each frequency curve could be different; however, this model is not recommended for multiple frequencies [13].
The parameters α, β, and γ were extracted from the measured path loss (Fig. 4) using the least squares method [13]. The derived values were α = 2.26, β = 30.99, and γ = 2.04. These values are similar to those of the site-general model of ITU-R Recommendation P.1411–9 [8], which are α = 2.12, β = 19.2, and γ = 2.11. Second, the smooth curves obtained from Eq. (1) were plotted in Fig. 4 (dotted lines). Finally, the appropriate reach distances at 95 dB of path loss were determined. The reach distances for the urban environment were 881, 680, 363, 252, 175, 135, 85, 50, and 39 m for 0.75, 1, 2, 3, 4.5, 6, 10, 18, and 24 GHz, respectively. The values are listed in Table 3. As expected, the reach distance was inversely proportional to the frequency.

LoS reach distances and ratios derived from fitted path loss curves
Fig. 5 shows the measured and curve-fitted path losses in the rural environment of Naju, Korea (see Section II-2). The derived values were α = 1.65, β = 40.86, and γ = 2.03.
Measured and curve-fitted path losses derived using the ABG model in the rural environment (Naju) at (a) 0.75, 1, and 2 GHz, (b) 3, 4.5, and 6 GHz, and (c) 10, 18, and 24 GHz.
As in the urban environment, the reach distances were calculated. They were 2,711, 1,905, 814, 495, 301, 212, 113, 55, and 39 m for 0.75, 1, 2, 3, 4.5, 6, 10, 18, and 24 GHz, respectively. These values are also displayed in Table 3. Notably, the curve for the rural environment was less steep due to the smaller α-value, and as a result, the reach distance was longer. This may have been caused by the absence of obstacles, such as buildings.
2. LoS Reach Distance and Ratio
The reach distances were calculated for the fitted curves (Table 3, Fig. 6). As shown in Fig. 6, the curve of the reach distance is almost straight, and the slope of the urban area is not steep compared to that of the rural area. On the other hand, at low frequencies, the reach distance in the urban environment was shorter than that in the rural environment. For example, the reach distance at 1 GHz was 680 m in the urban environment and 1,905 m in the rural environment. However, as the frequency increased, the reach distances converged, as shown in Fig. 6. The reason might be the shorter wavelength compared with the circumstances, such as buildings.

LoS reach distances of wave propagation in the urban (Gwangju) and rural (Naju) environments.
Table 3 also shows the normalized ratios of the LoS reach distances derived from the individual environments. The normalization reference is 24 GHz. The normalized ratios are plotted in Fig. 7. As in Fig. 6, the slope of the urban-only environment is not steep compared to that of the rural-only environment. However, the two curves converge as the frequency increases. A communication service area is not configured for a single environment. The ratio varies depending on the proportions of urban and rural areas in a city or country [14]. We calculated two combined urban-rural cases in ratios of 1:1 and 1:5 based on the studied area sizes. The results are shown in Table 3 and Fig. 7. As an example, the combined 1:5 ratio for 0.75 GHz was 61.69 times higher than that for 24 GHz.
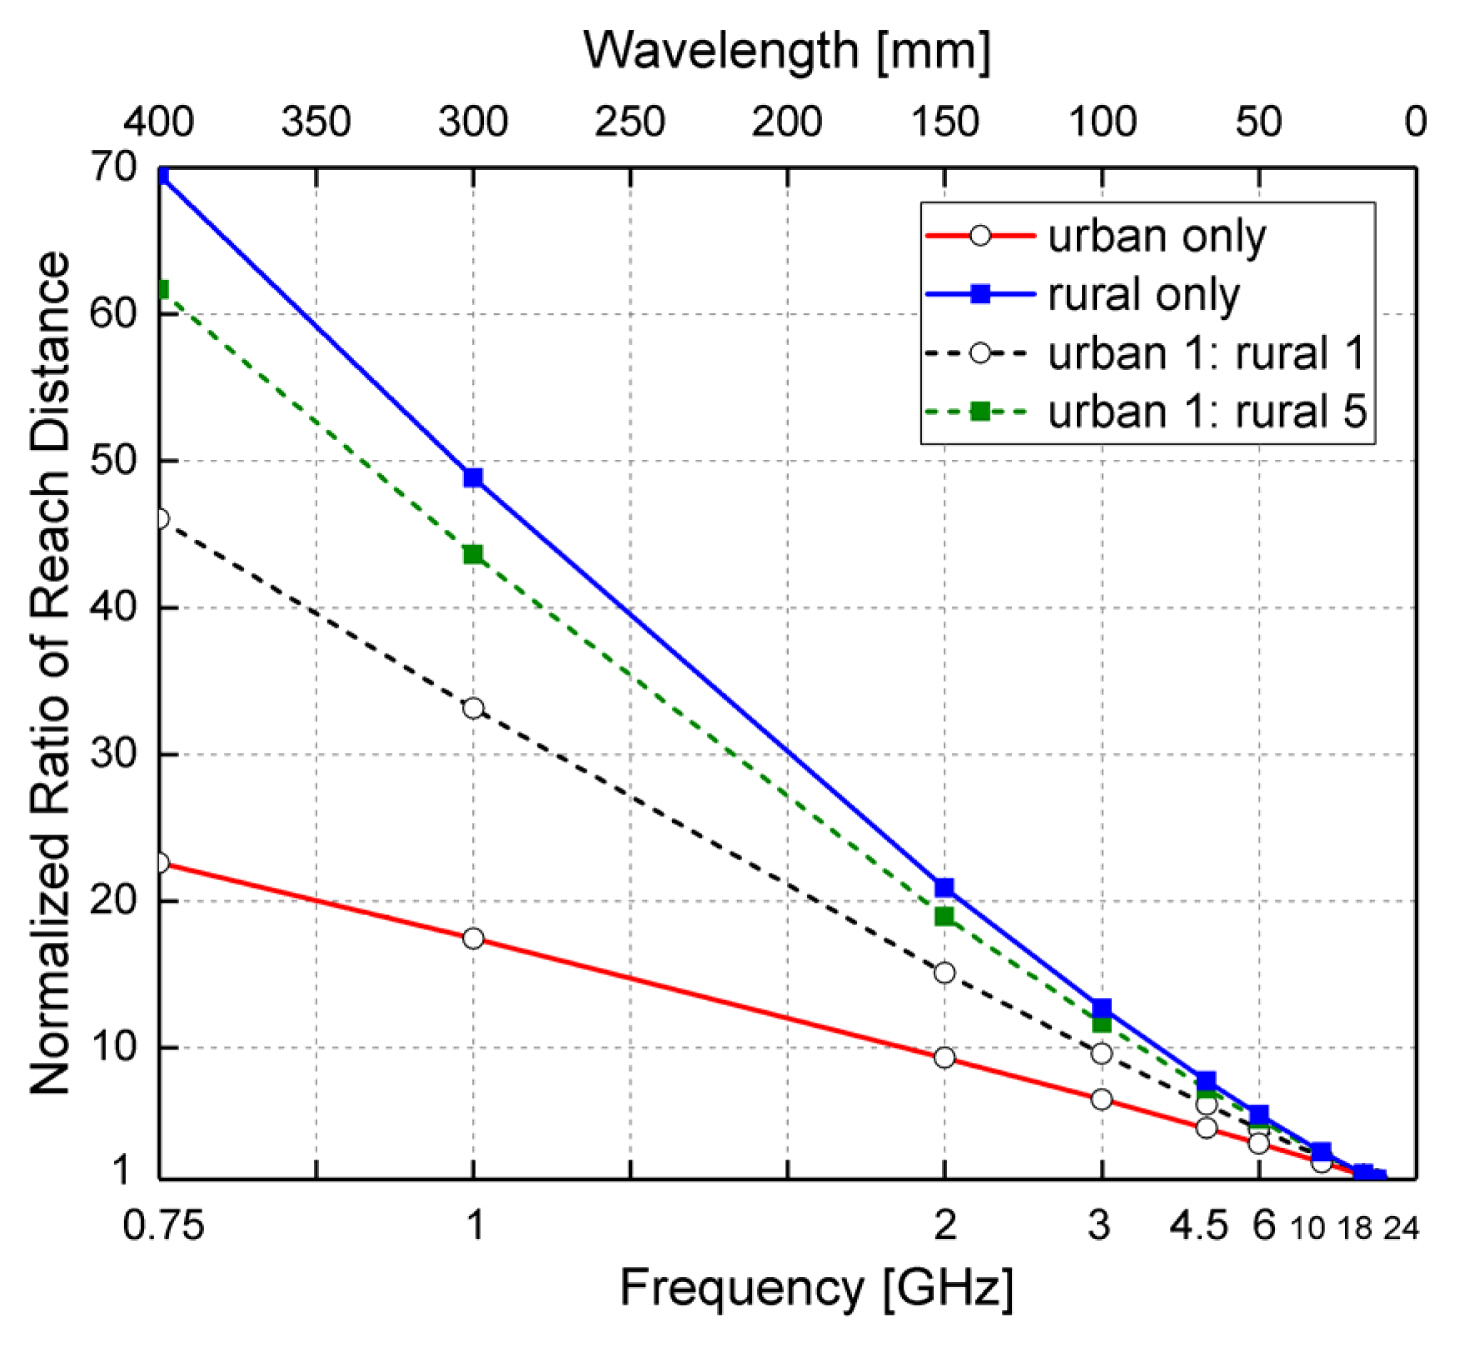
Normalized individual and combined reach distance ratios.
IV. Conclusion
In this study, we collected experimental transmittance data in urban and rural environments at 0.75, 1, 2, 3, 4.5, 6, 10, 18, and 24 GHz. The Rx antenna moved along an LoS. The measured data were fitted to determine the reach distance at each frequency using the ABG model. Individual and combined urban-rural reach distance ratios were calculated and compared. For example, the combined ratios for an urban-to-rural ratio of 1:5 were 61.69, 11.65, 5.11, and 1.00 at 0.75, 3, 6, and 24 GHz, respectively. Although we examined the path loss under LoS conditions only, these data can be used to set service costs and policies for mobile communication systems in many countries.
Acknowledgments
This work was supported by the ICT R&D program of the Ministry of Science, ICT, and Future Planning (MSIP)/ Institute for Information & Communications Technology Planning & Evaluation (IITP) (No. 2018-0-01439, Analysis of Radio Propagation Characteristics and Development of Prediction Models in Indoor and Outdoor Environments below 40 GHz) and a grant from Chosun University, Korea (2017).
References
Propagation data and prediction methods for the planning of short-range outdoor radiocommunication systems and radio local area networks in the frequency range 300 MHz to 100 GHz, ITU-R 1411-9, 2017
Biography

Soon-Soo Oh received B.S. and M.S. degrees in electronics engineering from Inha University, Incheon, Korea, in 1998 and 2000, respectively, and a Ph.D. degree in radio sciences and engineering from Korea University, Seoul, Korea. From May 2005 to August 2013, he was a Senior Member of Engineering Staff in the Electronics and Telecommunications Research Institute (ETRI). He has been an assistant professor since September 2013 and an associate professor since September 2017 at the Department of Electronics Engineering of Chosun University, Gwangju, Korea. His research interests include the analysis/design of array antennas, electromagnetic field measurements, and radio wave propagation.

Jae-Won Choi received B.S. and M.S. degrees in electronics engineering from Chosun University, Gwangju, Korea, in 2016 and 2018, respectively. Since April 2018, he has been an assistant researcher with the Convergence Technology Center at Incheon Technopark. His research interests include the analysis/design of array antennas, radar, and wave propagation.

Dong-Woo Kim received B.S. and M.S. degrees in electronics engineering from Chosun University, Gwangju, Korea, in 2018. Since September 2018, he has been pursuing his Ph.D. degree at the Department of Electronics Engineering of Chosun University. His research interests include the analysis and design of array antennas, wave propagation, and communications.

Young-Chul Lee received B.S. and M.S. degrees in electronic engineering from Yeungnam University, Gyeongsan, Korea, in 1995 and 1997, respectively, and a Ph.D. degree in electronic engineering from Information and Communications University (ICU; merged with the Korea Advanced Institute of Science and Technology [KAIST] in 2009), Daejeon, Korea, in 2005. From 1997 to 2000, he was with the R&D Division of LG Semicon Inc., Cheongju, Korea, where he was involved in the development of MOSFET devices for DRAM applications. Since 2005, he has been with Mokpo National Maritime University, Mokpo, Korea, where he is a full professor in the Division of Marine Mechatronics. In 2010, he participated in E-band wireless system research as a technical consultant at Telecom Malaysia Research & Development (TMRND), Malaysia. His professional interests include millimeter-wave circuits and systems, 3D integration of RF circuits using LTCC-based system-in-package (SiP) technology, and reconfigurable RF circuits. Since 2016, he has been interested in radio wave propagation and wireless power transmission.

Byung-Lok Cho received B.S., M.S., and Ph.D. degrees in electronics engineering from Sungkyunkwan University, Suwon, Korea, in 1987, 1990, and 1994, respectively. From 1987 to 1988, he was a researcher with Samsung Electronics, Inc. From 2001 to 2002, he was with the University of California, Davis, as a visiting researcher. He is currently a full processor at Sunchon National University, Suncheon, Korea. His research interests include the analysis/design of ultra-wideband and the Internet of Things (IoT).