Continuous Characterization of Permittivity over a Wide Bandwidth Using a Cavity Resonator
Article information
Abstract
We examine a rectangular cavity resonator method to accurately characterize the complex permittivity of dielectric materials over a wide frequency range of 1–5 GHz by exploiting the fundamental mode and higher-order TE(1,0,l) modes. For this purpose, a rectangular waveguide is coupled with a cavity resonator through a large inductive aperture. The permittivity characterization at both even and odd TE(1,0,l) modes enables continuous determination of the permittivity over operating frequencies. The characterization of the permittivity for even TE(1,0,l) modes suffers from potential errors due to the displacement of materials. This paper also proposes a method to compensate for these errors and improve the accuracy in the even modes. The experimental results of the fabricated cavity are presented using different materials (frequency-independent and frequency-dependent). The measured complex permittivity results show a good agreement with the reported results over a wide bandwidth available in the literature.
I. Introduction
The microwave dielectric properties of materials have been widely used for understanding the behavior and the characteristics of various materials [1]. The difference in dielectric materials drives various losses and reflections for microwave frequencies. The measurement of the permittivity of materials has been demanded in many fields such as the food industry [2] and medicine [3].
Various methods have examined the complex permittivity of materials as in [4]. Among such methods, the rectangular cavity resonator is widely used to accurately detect the complex permittivity of low- and medium-loss materials [5–8]. However, the drawback of the conventional cavity resonator method is that the bandwidth of the measurement is quite narrow.
In an effort to enhance the bandwidth of the measurement, previous works characterized permittivity in multiple odd TE(1,0,l) rlesonant modes [8]. The cavity method requires the material under test (MUT) to be placed where an E-field is strongest to maximize the perturbation [9] for all the modes (even and odd). In the even modes, the MUT position should be adjusted for each mode, so that it is located at the maximum E-field. A small displacement of the MUT from the maximum E-field position may introduce errors in the permittivity characterization. Conversely, in the odd modes, the maximum E-field always occurs at the center of the cavity. Therefore, the permittivity is usually in the odd modes only [5–8], with the position of the MUT fixed at the center of the cavity. As a result, the sampling of permittivity is sparse.
This study utilizes the multi-TE(1,0,l) (both even and odd) modes for cavity perturbation to obtain complex permittivity over broad bandwidth. By characterizing permittivity in the both even modes and odd modes, we increase the sampling density of the permittivity characterization within the frequency band. To suppress the displacement error in the even modes, this work proposes finding the maximum E-field spot directly from the S11 response. A commercial electromagnetic simulation and measurement results show that the complex permittivities of all the MUTs are observed with high accuracy in the odd and even TE(1,0,l) modes across the broadband from 1 GHz to 5 GHz.
II. Overall System Structure
For the reflectivity study, an individual coaxial-to-waveguide transition is loaded into the cavity as illustrated in Fig. 1(a). A closed-circuited metallic waveguide is integrated into the metallic cavity using an inductive aperture for the energy transaction. The system is designed to maximize power transfer to the cavity in the lowest mode by matching the impedance between the waveguide and the cavity with the essential aperture size in between [9] and [10]. As shown in Fig. 2(b), when the aperture height is fixed at 2 cm at f(1,0,1), the aperture width w = 13 cm has a minimum reflection coefficient S11 of the cavity. The height h and the width w of the rectangular aperture are accordingly determined to be 2 cm and 13 cm, respectively. The enclosed space inside the cavity is filled with air.
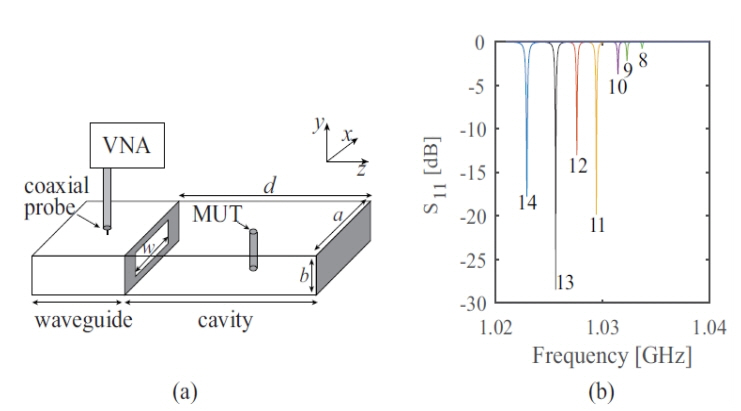
(a) Schematic diagram of the structure. (b) Simulated reflection coefficient S11 in the TE(1,0,1)mode depending on the aperture width w, where the aperture height is 2 cm. Numbers under the curves indicate the w of each curve in centimeters. w = 13 cm shows critical coupling in the TE(1,0,1) mode, and it is chosen as the aperture width.
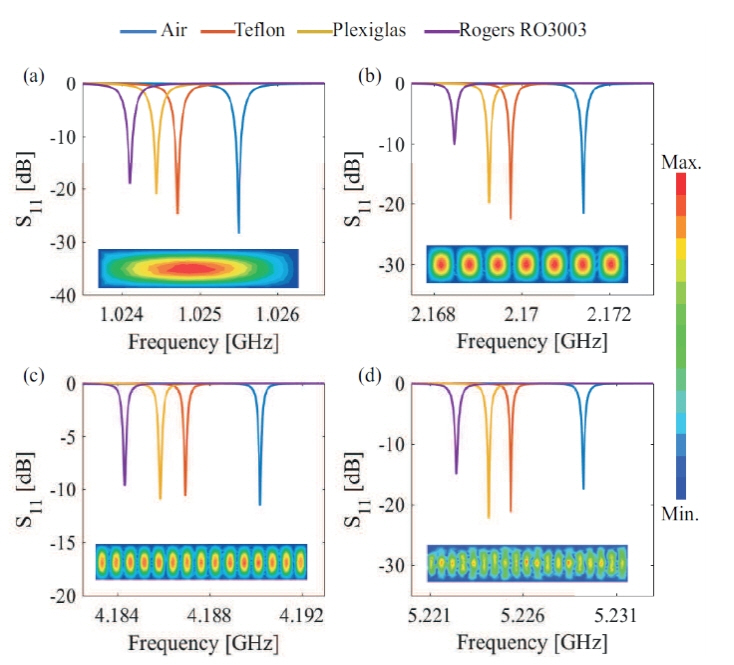
Simulated S11 the curves in the odd modes for different materials and the field distributions inside the cavity (inset). Resonant frequencies of the TE(1,0,1) mode at 1 GHz (a), TE(1,0,7) mode at 2 GHz (b), TE(1,0,15) mode at 4 GHz (c), and TE(1,0,19) mode at 5 GHz (d).
III. Cavity Resonator Method
In this work, the cavity length d along the z-axis is designed to be longer than the other dimensions: (d = 55 cm) >> (a = 15 cm) >> (b = 3 cm). This highly anisotropic design has a series of TE(1,0,l) resonant modes in the frequency band of interest. As a result, the resonant frequency between 1 GHz and 5 GHz has a simple expression given in [5]:
where ɛ0 and μ0 are the permittivity and permeability of free space, respectively.
The cavity resonator method deduces the complex permittivity of the MUT by measuring how much the resonant frequency is shifted. Eqs. (2), and (3) are used to determine the complex permittivity ɛr of materials [8]:
where
To obtain a denser sampling of permittivity, the permittivity in the even modes should also be characterized. However, the location of the maximum E-field changes mode to mode in the even modes as shown in the inset of Fig. 3. Theoretically, the E-field of the TE(1,0,1) mode has a maximum in every position of z(max,i)=d(2i–1)/2l, where i is an integer between 1 and l. Practically, the MUT position can be adjusted accordingly by having several holes at various locations or a rail way along the length of the resonant cavity. Nevertheless, any small deviation of the MUT position from the maximum E-field position in practice directly brings about errors in permittivity measurements at the even modes. A method to minimize such errors is described as follows.
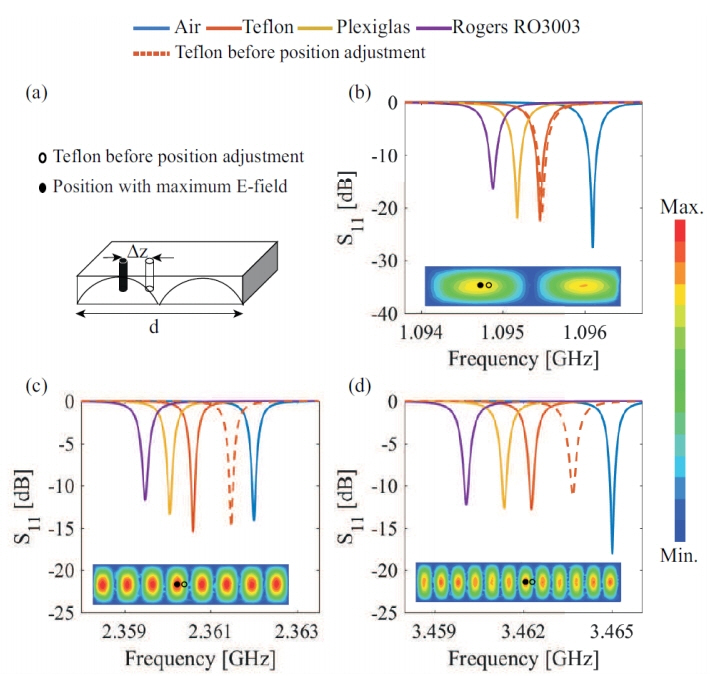
(a) In the even modes, the positions of the maximum E-field can be found at the points where S11 is maximally shifted. The shifted S11 curves in the selected even modes due to various MUTs are shown. The dashed red curves show the S11 curve with Teflon at arbitrary positions (empty dots). When Teflon is replaced at the position of the maximum E-field (filled dots), S11 is maximally shifted (red curves). (b) The TE(1,0,2) mode at 1 GHz, (c) TE(1,0,8) mode at 2 GHz, and (d) TE(1,0,12) mode at 3 GHz.
The dielectric constant equation given by (2) is based on the fact that the MUT is placed where |E| is at maximum and that |E| distributes sinusoidally in the cavity. If the MUT is displaced from the maximum position by Δz, where
The above equation demonstrates that the frequency shift is at maximum when Δz=0. This reduces the expression of (5) back to (2) as expected. In other words, the position of the maximum E-field can be found by finding the position where the frequency shift is at maximum. By re-positioning the MUT to the spot of the maximum frequency shift, the error due to displacement is minimized. To illustrate the shifts of the resonant frequency for Teflon at TE(1,0,2), TE(1,0,8), and TE(1,0,12) are shown in Fig. 3 for the even modes. When Teflon is misplaced from the position of the maximum E-field, the resonant frequency shifts are scaled down. Once the position of the MUT is decided upon to yield the maximum frequency shift with one material, the permittivity of other materials, such as Plexiglas and Rogers RO3003, can be measured sequentially in the same position, facilitating the characterization process of multiple MUTs.
IV. Measurement Setup
To validate the idea of the proposed cavity, the system is fabricated. The proposed system walls are made with aluminum material that has a conductivity of σa (σa = 3.816 × 10⁷). The walls are coated with a copper sheet to increase its conductivity as shown in the Fig. 4(a). The hole (rail way) is made in the proposed cavity starting from the center of the cavity to measure the complex permittivity of both modes (odd and even) as shown in Fig. 4(b). Fig. 4(c) illustrates the different MUTs used in the permittivity measurements of Plexiglas and fat phantom tissue. The unknown permittivity of MUTs can be calculated from Eqs. (2) and (3).
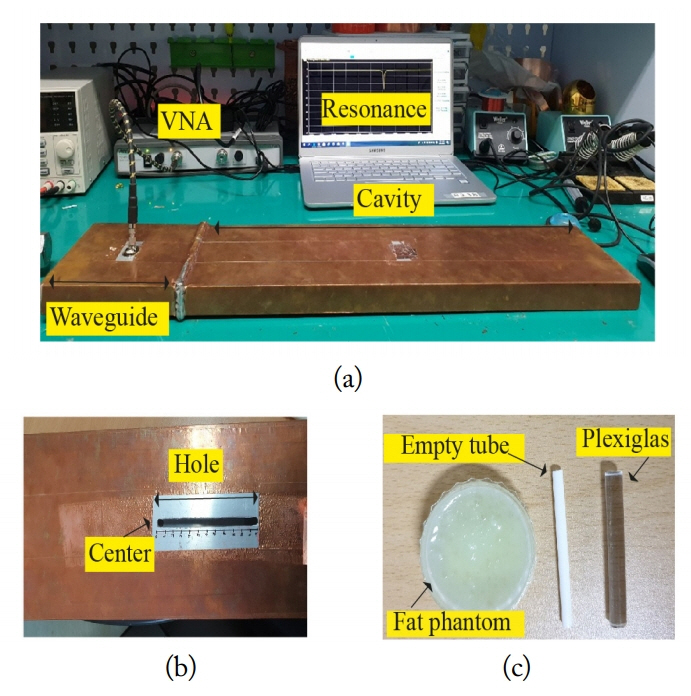
(a) Setup of the measurements. (b) Hole size. (c) MUT samples.
The fat phantom tissue, the permittivity of which is frequency dependent, is made as describe in [12]. Recently, various studies have observed fat thickness in the human body using a RF/microwave biosensor [13]. Phantom tissue has been used in many studies to observe the efficacy of the RF/microwave biosensor. Therefore, analyzing the permittivity of the fat phantom tissue, which should have a permittivity similar to that of the human fat, is essential. The fat phantom tissue is filled inside the empty tube to be inserted inside the proposed cavity to observe its permittivity. In the odd mode, the MUTs are placed at the center of the proposed cavity. However, in the even mode, the MUTs are inserted where the maximum shift occurs. The MUTs are moved through the hole of the rail as shown in Fig. 4(b). Then, the remaining open area of the hole (rail way) is closed by a copper sheet to reduce the air gap and prevent any leakage, and to reduce the measurement errors of the complex permittivity.
Prior to the measurements, an MS46122B vector network analyzer (VNA) is kept in calibration mode for one port. The entire setup is calibrated using three independent standards, namely open, short, and load, to reduce the effect of undesired losses and improves the accuracy of the measurement.
V. Results and Discussion
In the case of simulation, from the S11 responses of the odd and even modes, f(1,0,1) to f(1,0,19), as in Figs. 2 and 3 for the MUTs, the resonant frequencies f0 and fs are extracted to determine the real part of the permittivity. Then Q0 and Qs are considered to determine the imaginary part of permittivity. The Q factor is calculated from the 3-dB bandwidth. While Q0 ranges from (4.7697 × 10³ – 1.8061 × 10⁴), the Qs of Teflon, Plexiglas, and Rogers RO3003 are distributed as (4.7048 × 10³ – 1.7160 × 10⁴), (4.6778 × 10³ – 1.6744 × 10⁴), and (4.6340 × 10³ – 1.6150 × 10⁴), respectively.
Fig. 5 summarizes the real and imaginary parts of three perturbed MUTs obtained from a simulation over a series of TE(1,0,l) modes. The complex permittivities of Teflon, Plexiglas, and Rogers RO3003 are originally set in the simulation as (2.1 – 0.0021i, 2.5 – 0.003i, and 3.02 – 0.0048i), respectively. The restored complex permittivities in Fig. 5 from the proposed method show |ɛr| errors less than 1% for Teflon and less than 2 % for Plexiglas and Rogers RO3003, as shown in Fig. 6. From the simulation, the mean values of the complex permittivities of Teflon, Plexiglas, and Rogers RO3003 at 1–5 GHz are (2.1000 ± 0.0015 – 0.002i ± 0.5088), (2.4805 ± 0.0045 – 0.0030i ± 0.6009), and (2.9888 ± 0.0064 – 0.0047i ± 0.7238), respectively.

Complex permittivity of MUTs.
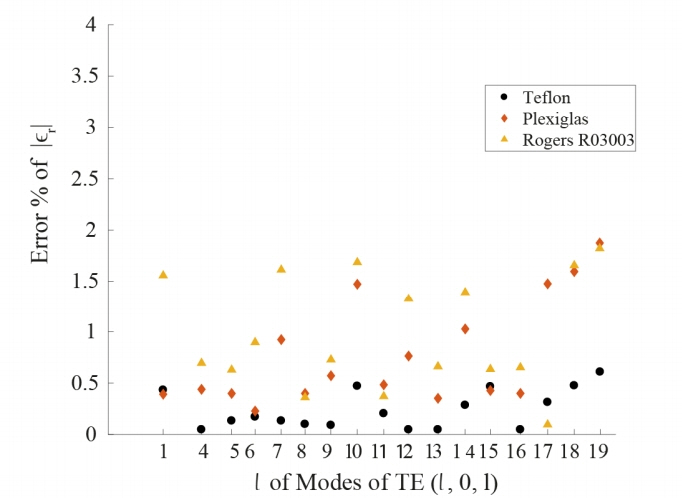
Complex permittivity |ɛr| error of materials.
In the case of measurements, we examine the complex permittivity of both odd and even modes at f(1,0,l). To prove the concept, we observe the odd modes at 1, 3, and 5 GHz and the even modes at 2 and 4 GHz. In the first step, we study the complex permittivity of Plexiglas rod, with Plexiglas being frequency independent. The Plexiglas rod has a height of b and a radius of 0.3 cm. Fig. 7 illustrates the complex permittivity of the Plexiglas rod with a comparison with [14].
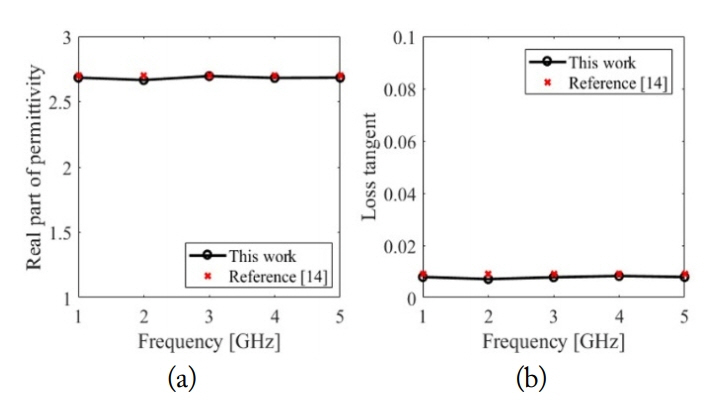
The complex permittivity of Plexiglas. (a) The real part of the permittivity of Plexiglas. (b) The loss tangent of Plexiglas.
Next, we study the complex permittivity for the fat phantom tissue. Fig. 8 shows that the permittivity measurement of the fat phantom tissue has the same trend as in the literature over a wide bandwidth [12, 15]. The permittivity of the fat phantom tissue decreases by increasing the frequency. Therefore, the fat phantom tissue can be used instead of real fat tissue for experiments that require human/animal fat tissues.
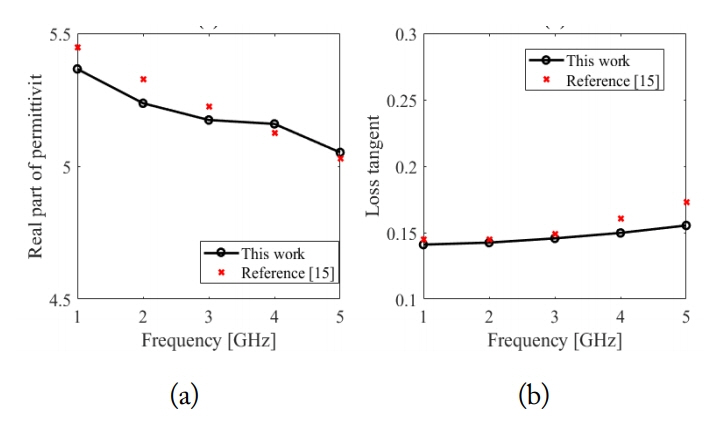
Complex permittivity of fat phantom tissue. (a) Real part of the permittivity of the fat phantom tissue. (b) Loss tangent of the fat phantom tissue.
VI. Conclusion
The proposed rectangular cavity resonator is presented to characterize the complex permittivity of low-loss materials in the range of 1–5 GHz for use in various applications. This method allows the accurate measurement of the permittivity of MUTs in a discrete, dense set of frequencies over a broad bandwidth.
Acknowledgments
This work was supported by the National Research Foundation of Korea (No. NRF-2017 R1C1B2009892 and NRF-2018R1A6A1A03025708).
References
Biography

Rehab S. Hassan received her B.S. in biomedical engineering and systems from El-Shorouk Academy, Egypt, in 2010 and her M.S. in biomedical engineering and systems with specialization in photonics from Cairo University, Egypt, in 2013. She served as a senior biomedical engineer in Promega Corporation Medical Devices with Delta Trading and Development Company, Ltd., Egypt, from 2011 to 2016. She is currently pursuing her Ph.D. degree in biomedical engineering at Kyung Hee University, South Korea. Her research interests include the application of RF/microwave technology in medicine, electromagnetic theories, passive implantable sensor, and wireless power transmission.

Ashwini Kumar Arya received his B.E. in electronics and communication engineering in 2005 from HNB Garhwal University, India and his M.Tech. in electronics communication engineering in 2007 from GBPUAT Pantnagar, India. He received his Ph.D. in radio frequency and microwave engineering in 2013 from the Indian Institute of Technology, India. He worked as a post-doctoral researcher from 2014 to 2016 in the Department of Electrical Engineering, KAIST, Daejeon, South Korea. Before joining Kyung Hee University, he worked as an assistant professor in the Department of Electronics and Communication Engineering, GBPUAT, India. Currently he works as a research professor at the Institute for Wearable Convergence Electronics, Kyung Hee University, Yongin, South Korea, and is also affiliated with the Department of Electronics Engineering, Kyung Hee University, Yongin, South Korea. His research interests include the applications of radio frequency engineering, electromagnetic theory in wireless communication and antenna design and technology for various applications.

Sung Ik Park received his B.S. degree in electrical engineering from Kyung Hee University, Yongin, Korea, in 2019. He is currently working toward his M.S. in electrical engineering from Kyung Hee University. His research interests include microwave antennas, radio frequency cavity resonator, and wireless power transmission.

Sanghoek Kim received his B.S. degree with a double major in electrical engineering and mathematical science from Seoul National University, Korea, in 2007, and his M.S. and Ph.D. degrees in electrical engineering from Stanford University, USA, in 2013. He was a recipient of the Kwanjeong Scholarship during his study. After graduation, he worked at Qualcomm Inc., as a signal/power integrity engineer and in Si-Beam, Inc., as an mm-wave system engineer. In 2016, he joined the Department of Electronics Engineering, Kyung Hee University as an assistant professor. Currently, his research interests include the applications of radio frequency technology and electromagnetics theory in wireless interface with bio-implantable devices, bio-medicine, and radar technologies.