A Study on the Convenient EMF Compliance Assessment for Base Station Installations at a Millimeter Wave Frequency
Article information
Abstract
This paper studies a convenient electromagnetic field (EMF) compliance assessment for base station installations at a millimeter wave (mmW) frequency. We utilize ray-tracing analysis as a numerical method for examining the wave propagation characteristic. Various installation cases are considered and the important parameters with a significant effect on the maximum power density levels are produced. We finally suggest the several scenarios for the convenient assessment of mmW base stations, which allow us to conduct cost effective computational tests compared with the current assessment procedure in the guideline.
I. Introduction
With the development and progress of information and communication technology, the issue of next fifth generation (5G) communication is under active discussion. One of the prominent features of this 5G technology is using the millimeter wave (mmW) frequency [1, 2] to allow the larger bandwidth for higher-rate data transmissions. Since the electromagnetic (EM) wave suffers from higher path loss attenuation as it propagates on this mmW frequency range [3], we should generally employ high-gain array antennas [4, 5] for a base station (BS) to compensate for this decrease rate of the received power level. The well-known beamforming technique is also employed to achieve wave focusing [6, 7]. Moreover, more severe diffraction loss at the mmW forces us to deploy denser BSs than the current cellular bands to retain the communication link at the shadow region. Hence the EM field (EMF) compliance assessment cost of a BS can grow in a geometrical progression, since this assessment should be conducted for all BSs installed according to the measurement procedure in the present ordinance [8].
The aim of this paper is studying the convenient EMF compliance assessment of an mmW BS and proposing scenarios for low-cost EMF computational tests. Based on the ray-tracing analysis results, we produce several important parameters for the mmW BS compliance based on the maximum power densities (PDs). Finally, we provide the several scenarios allowing us to promote the time cost savings for the compliance assessment.
II. EMF Compliance of MMW Base Stations
Ray-tracing analysis has been widely used to examine the wave propagation characteristics of the urban environment at mmW frequency [9–11]. We employ this ray-tracing method for investigating the exposure level distributions from an mmW BS. Simulations are carried out with our full three-dimensional (3D) ray-tracing simulator based on the uniform theory of diffraction [12]. Installations in urban regions are considered since the 5G deployment is expected to begin in urban hot-spot networks where the most mobile traffic is concentrated. The 3D urban model based on the environmental profile near Isu Station in Seoul is utilized for simulations. The installed BS characteristics for simulations are as described in Table 1. The center frequency is assumed to be 28 GHz. Although we only consider the single-beam transmission in this paper, the fundamental methods and results are readily extendable to a multi-beam BS antenna [13] thanks to the superposition principle.

Default BS characteristics for numerical studies
Since the exposure metric for compliance changes from the specific-absorption rate (SAR) to PD at this mmW frequency range [14], we use this PD as the reference level metric for BS compliance (note that SAR is widely employed for the compliance of the current wireless communication [15, 16]). Fig. 1 shows the PD profiles for various mmW BS installation cases. The BS is located at the coordinate origin (marked as the black circle) and the vertical polarization is considered unless otherwise indicated. We consider up to two reflections and one diffraction because the maximum (worst-case) exposure level is the most important for a compliance assessment. The computations are terminated when the rays drop below −180 dB and the PDs are calculated with 1.3 m resolution. The exposure levels are displayed at z = 1.7 m from the ground, which is one of the measurement heights indicated in the present ordinance [8]. The ground EM property at mmW is assumed as earth with ɛr = 15 and σ = 1.336 S/m [9]. In Fig. 1, the x-axis (y-axis) denotes the horizontal (vertical) distance in meters from the BS and the color bar indicates the PD levels in the decibel scale (dBW/m2). The main beam peak direction is depicted in Fig. 1 as an arrow. For cases Fig. 1(a) and (b), the BS is placed at 1.7 m height above the building rooftop of 14 m, i.e., 15.7 m above the ground. The total down-tilt angle of the BS antenna is 10°. In these cases, it can be seen that the maximum (worst-case) PD level appears at the NLOS region of the BS main beam; more precisely, it is found in the geometrically reflected path of the BS main beam along the horizontal measurement plane. This is mainly due to the reflection from the opposite building wall that is directly illuminated by the main beam. Considering the current BS compliance assessment procedure [8] where the measurement test should be conducted along the path of the maximum beam direction (i.e., under the worst-case assumption), these NLOS-maximum results have great implications for us and should be considered when the 5G mmW BS assessment guideline is established. The different locations of the maximum PD between Fig. 1(a) and (b) are due to the reflections from the different building models (i.e., PEC and dielectric), giving rise to the differences in the (equivalent) image BSs. In addition, the maximum PD levels for the PEC and concrete building model (ɛr = 6.5 and σ = 0.668 S/m [9]) are −16.284 and −25.992 dBW/m2, respectively, representing a 10-dB difference between the two cases, while our multiple simulation studies show that the EM property of the ground does not cause significant differences in the worst-case PD levels.

Power density profiles from various mmW BS installations. (a) PEC building model, BS height = 15.7 m. (b) Dielectric building model, BS height = 15.7 m. (c) Dielectric building model, BS height = 5 m.
Recalling that the EMF compliance assessment is mostly conducted under the “conservative”, “worst-case” conditions and operation mode [8, 17], it is known from these contexts that the EM property of the building should become an important parameter to set up simplified scenarios for the convenient compliance assessment. Furthermore, we also investigate the installation case of z = 5 m above the ground in Fig. 1(c) where the BS is attached to the building wall. In this case, the maximum PD level is placed in the BS LOS region. This may also stem from the main beam peak direction, which directly faces the ground plane. From these numerical studies, we can find an additional important parameter, which is the BS main beam peak direction determining the maximum exposure location (i.e., NLOS or LOS region of the main beam). Since this main beam peak direction strongly depends on the BS installation height, this should become significant for the scenario set-up. We also know from several numerical studies that the vertical beamwidth should be important. In contrast, the horizontal beamwidth does not have a great influence on the maximum PD level. This is because the main beam peak direction would only strongly depend on the relative vertical environments of the BS installation.
Fig. 2 displays the PD curves along the reflected path in Fig. 1(b), where the maximum level occurs. The three different heights in Fig. 2, corresponding with the human body area, are identical to the measurement heights for the BS compliance assessment [8]. Here, the PDs are computed with a 0.1 m interval. It can be clearly seen that the PD profiles among the observation heights show little difference, even with the millimeter-scale shorter wavelength. In addition, the maximum (worst-case) levels are extremely similar among the three observation heights, where the differences are below 0.5 dB in all cases. These somewhat unexpected results are highly significant, as they indicate that we could employ the fixed-point measurement (or calculation) for an EMF compliance assessment and the measurement sensitivity variations along the observation heights or the corresponding spatial average scheme [17] would not become a highly important issue for mmW BS compliance. In contrast, the PD levels along the horizontal observation path show extreme fluctuations. These results reveal that the appropriate sampling scheme along the horizontal measurement (or calculation) path could be a more significant problem. Furthermore, it can be seen that there are some PD level differences between the two polarizations; hence the BS polarization needs to be considered as an important parameter when performing a compliance assessment.
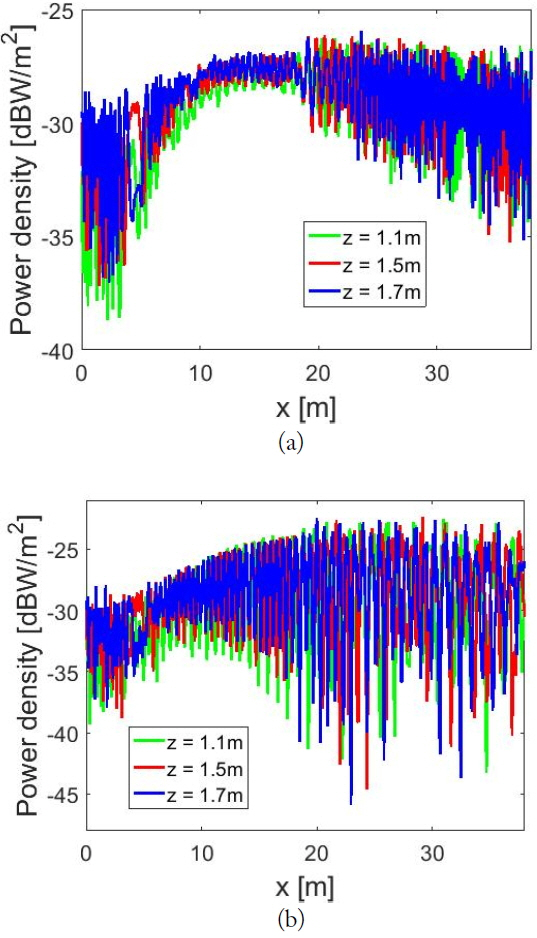
Power density profile along the maximum PD level path for different heights. (a) Vertical polarization and (b) horizontal polarization.
Based on the above investigations, we can establish several scenarios to be of great help for an mmW BS compliance test. These are depicted in Fig. 3, and they can be widely used for a convenient assessment instead of the present mandatory procedure based on the real complex environment. All cases are classified according to the primary spot directly illuminated by the main beam peak, since the maximum (worst-case) levels would be placed around this region due to the high array gain and the higher attenuation at mmW. These are produced by using the important parameters derived from the above numerical investigations and simplifying the surrounding complex environmental profiles. In Fig. 3, the ground and building are modeled as PEC to describe the worst-case condition and the parameters have the following definitions:
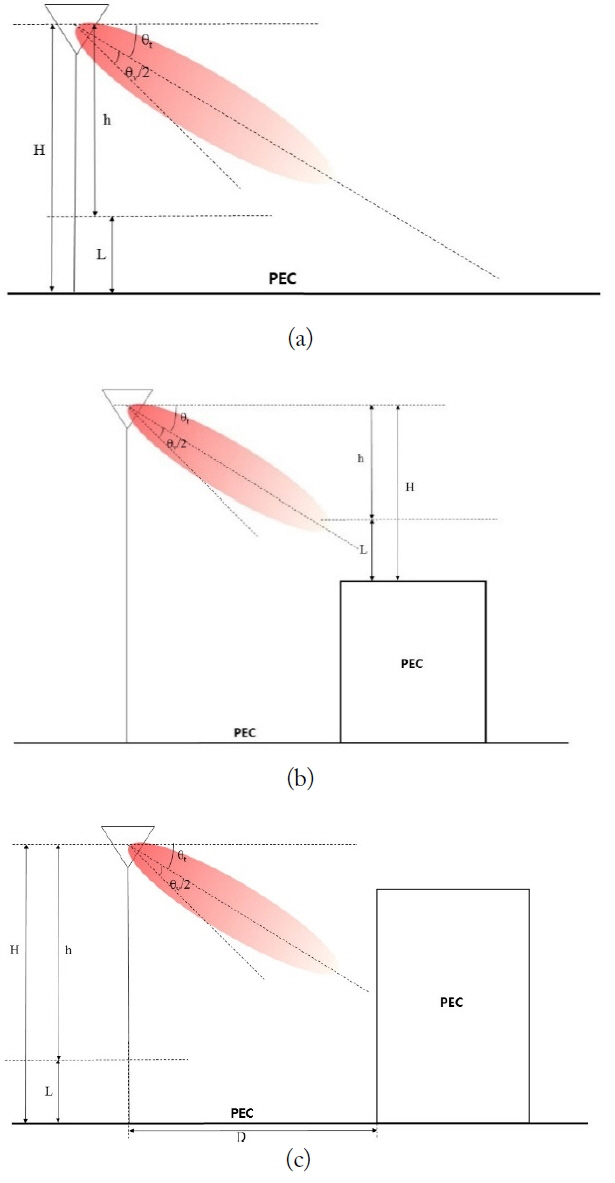
Scenarios for a convenient compliance assessment of an mmW BS. (a) Ground illumination, (b) rooftop illumination, and (c) opposite building wall illumination.
H: installation height of the BS antenna from the ground or the rooftop where the main beam illuminates;
L: measurement or calculation height (corresponds to the area occupied by the human body);
h: relative height defined by ‘H-L’;
θt: total down-tilt angle of a BS antenna (includes mechanical and electrical down-tilt);
θv: vertical beamwidth of the BS antenna; and
T: height of the model of an opposite building wall.
Tables 2 and 3 show the maximum PD results based on these scenarios with different models of the ground and building and two polarizations. The parameters for simulations were chosen as H = 5 m, L = 1.7 m, θt = 10°, and D = 14 m (as a four-lane road). It is evident that the maximum PDs do not show considerable variations between different properties of the ground, while a slight deviation of about 2.5 dB can be observed between the different building models. In addition, the PEC models represent the worst-case exposure in all cases. These scenarios can enable us to conduct the low-cost computational test as an alternative to the current procedure [8] that is mandatory for all installed BSs in the actual environment. Considering the small cell deployment and consequent denser installation of future 5G networks, the more simplified test based on these scenarios can bring huge benefits.


III. Conclusion
This paper studied a convenient EMF compliance assessment for an mmW BS. The ray-tracing method was employed, and the PD levels were investigated for various installation cases. Important parameters with a great influence on the maximum (worst-case) PD level were produced, and several scenarios for convenient compliance assessments were established from the numerical results. These scenarios can greatly facilitate more efficient compliance tests on the time and cost side.
Acknowledgments
This work was supported by Institute for Information & communications Technology Promotion (IITP) grant funded by the Korea government (MSIT) (No. 2017-0-00961, Study on the EMF Exposure Control in Smart Society).
References
Biography
Young Seung Lee received his M.S. degree and Ph.D. degrees in electrical and electronic engineering from the Korea Advanced Institute of Science and Technology (KAIST), Daejeon, Korea, in 2008 and 2012, respectively. Since 2012, he has been with the Electronics and Telecommunications Research Institute, where he is presently a senior researcher. His current research interests are compliance assessments, exposure systems and modeling with the millimeter-wave frequency. He is also concerned with electromagnetic theory.

Hyung-Do Choi received M.S. and Ph.D. degree in material sciences from Korea University in 1989 and 1996, respectively. Since 1997, he has been with Electronics and Telecommunications Research Institute, Korea, where he is presently a project leader of Radio & Satellite Research Division. He has carried out research in field of biological effects of RF radiation and developed RF radiation protection standards.

Haeng-Seon Lee received the B.S. degree in electronic engineering from Seoul National University, Seoul, Korea, in 1995, and the M.S. and Ph.D. degrees in electrical engineering from the Korea Advanced Institute of Science and Technology (KAIST), Daejeon, Korea, in 1997 and 2000, respectively. From 2000 to 2004, he was with LG Electronics. He then joined the Department of Electronic Engineering, Sogang University, Seoul, where he is currently Professor. His main research interests include simulation techniques on electromagnetic scattering, wave propagations and electromagnetic compatibility.